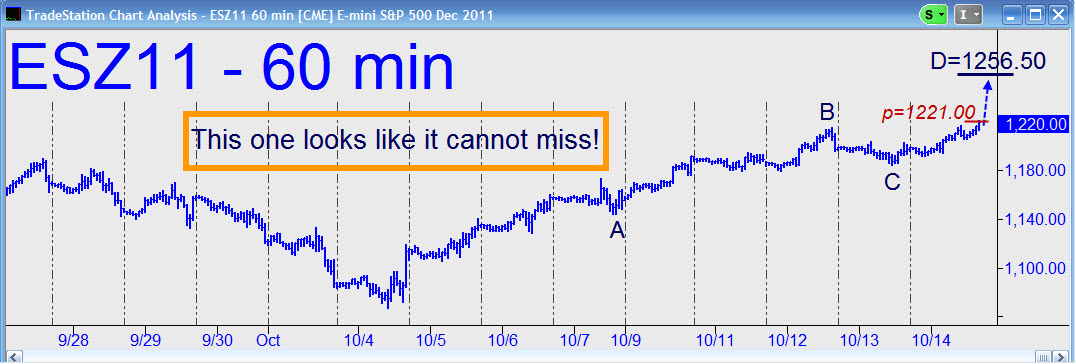
 So, now we know exactly where the futures are headed on the next thrust: 1256.50. This target is trail’s end for the pattern shown, which leaps to the eye in the somewhat scrunched-up hourly chart reproduced alongside. I am displaying it in a different aspect than usual because it somehow looks more compelling in compression than when unfurled. I was not surprised to discover that the high of Friday’s lunatic lunge fell just two ticks from the 1221.00 midpoint sibling of the target — yet another reason why we should be absolutely confident about the destination of this rally if and when it pushes above the midpoint. It can serve as our minimum upside projection at that point, and so our trading bias should be aggressively bullish, since upside potential would be worth nearly $1800 per contract if my assumptions prove correct. Camouflageurs looking for a way to get long should notice that there’s a 1.75-point gap between the 1222.00 peak recorded on September 1 and the “conventional” breakout peak at 1223.75 hit a day earlier. A small — and presumably fleeting — pullback from somewhere between the two could set up a perfect buying opportunity. ______ UPDATE (2:59 p.m. EDT): Rich Cash at Big4 says he went short before today’s plunge. In the forum, I responded as follows: “Nicely timed, I’d say — especially considering yours truly began the new week complacent that my next bullish target would be reached more or less routinely. My savvy friend Doug at UBS thinks the serious selloff we’ve all been expecting has in fact begun today, and that the momentous Merkel-Sarkozy announcement in early November will not hold the furies in abeyance. His bearish take is based on Bob Farrell’s rule about what happens when all of the experts get on the same side of the trade. In this case, he said that “everyone” is focused on the same, bullish target at 1256 that I was using for the E-Mini S&Ps. It is still valid in theory, but today’s selloff has rendered the pattern itself much less compelling.”
