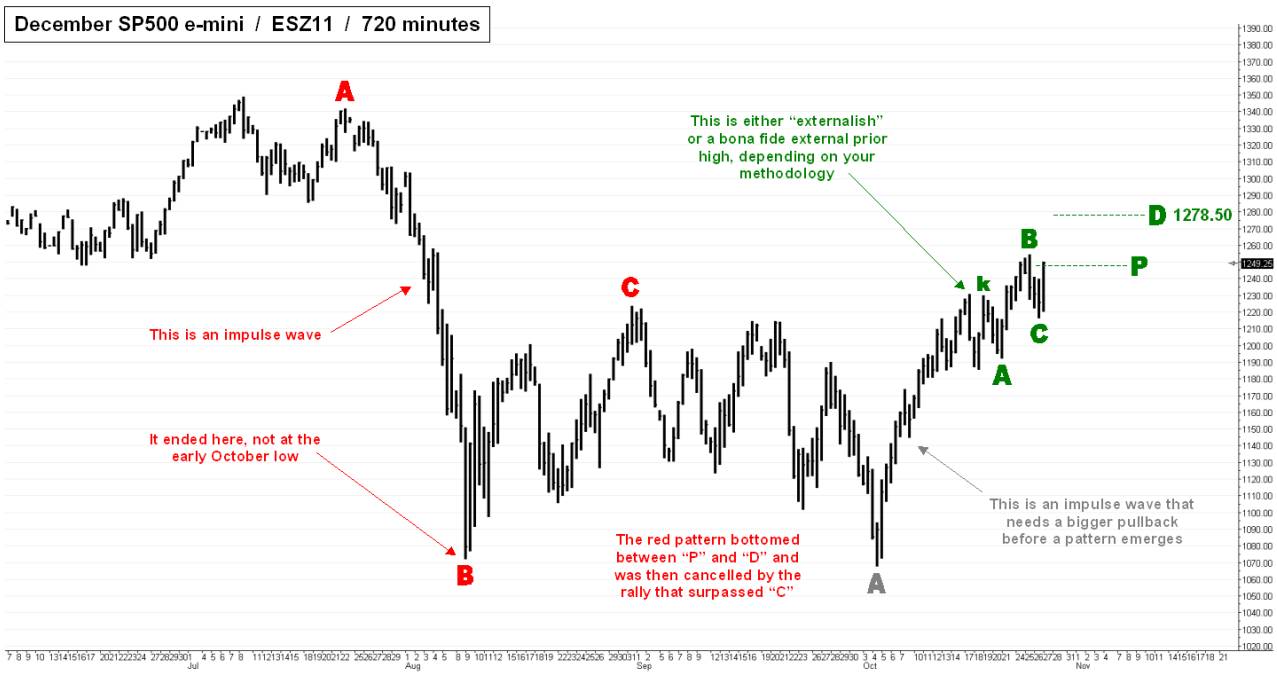
 News out of the Eurozone has propelled S&P futures upward and through a midpoint pivot whose sibling “D” target of 1278.50 is now in play. The stock-market rally of early October cancelled the pattern whose impulse wave was the memorable midsummer plunge, and the relentlessness of the recovery meant that it lacked the kind of structure that hidden pivotry thrives on. But the up-and-down trading of the last two weeks has made the ES charts interesting to us once again. The 1278.50 “D” target comes from a small but elegant pattern that formed in the recent volatility. A larger bullish impulse wave began at the October 4 low (it didn’t pause long enough to give us a one-off A). But all impulse waves must come to an end, and where better to do so than at 1278.50? Traders can short that well-hidden pivot at 1277.75 or perhaps a tick or two higher, with a stop not below 1279.25. (Posted by Doug “harry” McLagan) _______ UPDATE (2:00pm EDT): The futures spent half an hour deciding whether to reverse at 1278.50 and finally chose to push higher.
