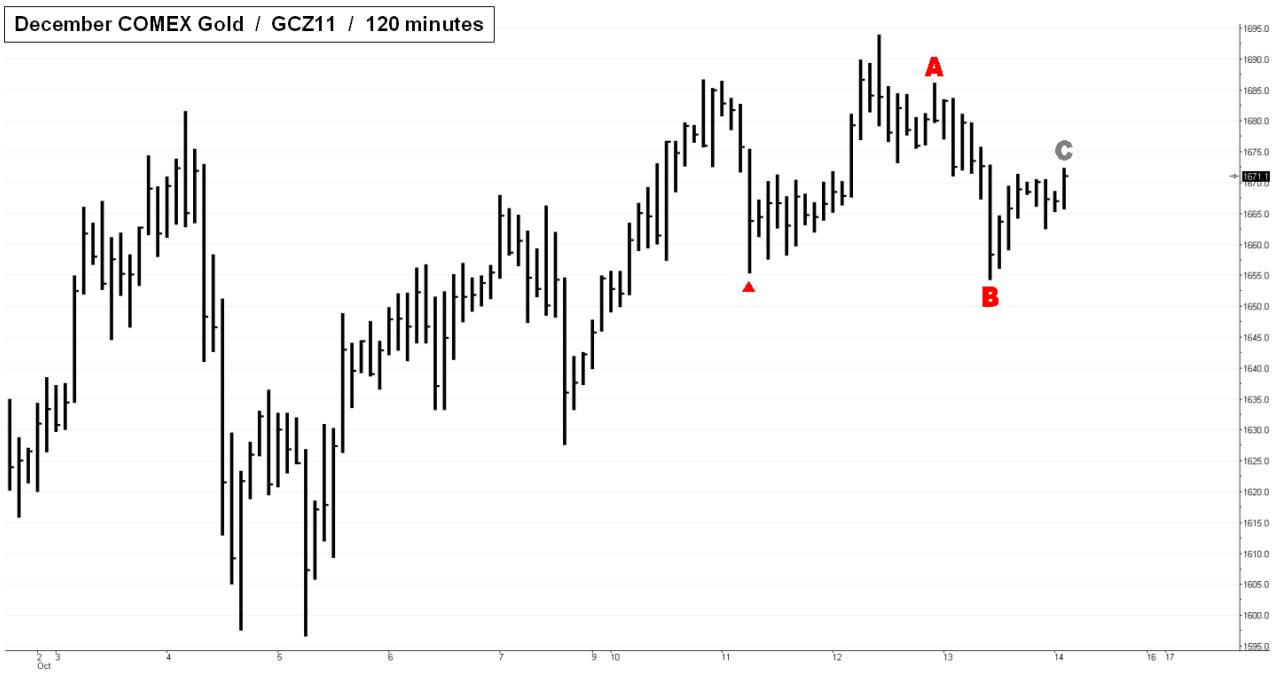
 If the modest decline in gold and silver yesterday brought about a trend change, it was from slightly upward to perfectly sideways. Gold fell below the “C” point of the pattern that we watched for a couple of days, and a small but elegant bearish pattern was emerging on Thursday evening (A=1686.10). Traders should watch for this pattern to be activated and to calculate and evaluate the pivots for tradeworthiness. Based on the size of the impulse wave, stop-losses should be at least four ticks below either pivot. In the larger scheme of things, the charts are not telling us which way the next strong move will go, but it continues to seem reasonable to expect a follow-through move down, echoing the recent drop to 1535.00, perhaps after some further recovery. It might be that the gold market will have to decide, as it were, whether to “wash out” with a deeper pullback low fairly soon, or to consolidate sideways for longer than a lot of traders might be expecting. (Posted by Doug “harry” McLagan)
