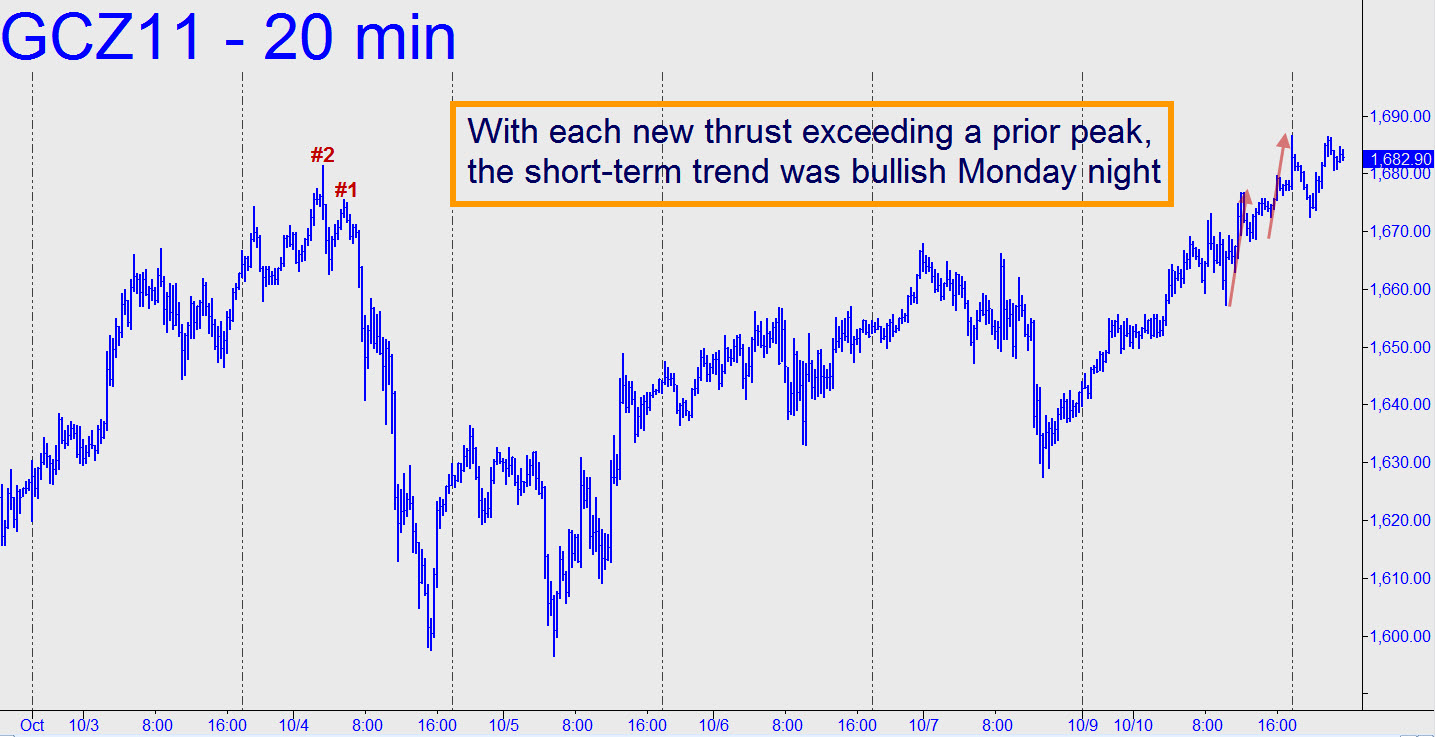
 The gold market is going to have to tell us whether it is back in bullish gear or merely retracing before another leg down. Just after 6:00pm Eastern Time, the futures popped up through their recent high of 1681.50, which cancelled all active bearish patterns for the time being. But our method tells us that gold probably has some unfinished business on the downside, given the recent strong decline to 1535.00. That move came all the way from 1923.70, but it intensified greatly from 1819.40, which we can use as an “A” point if and when such a pattern is confirmed. The decline from there has already retraced by more than half, which ensures that the midpoint (if confirmed) will be above the 1535.00 low. In the meantime we should watch two levels in particular: 1701.50, the “D” target of a pattern which began at 1629.20 (20-minute chart or lower); and 1756.30, the midpoint of a large pattern with “A” at 1481.0 on the weekly chart. If gold’s current buoyancy is only a BC retracement in progress, one of these levels might become the “C” point that we are looking for. Traders shorting the 1701.50 target should put their stops no lower than 1702.10. (Posted by Doug “harry” McLagan)
