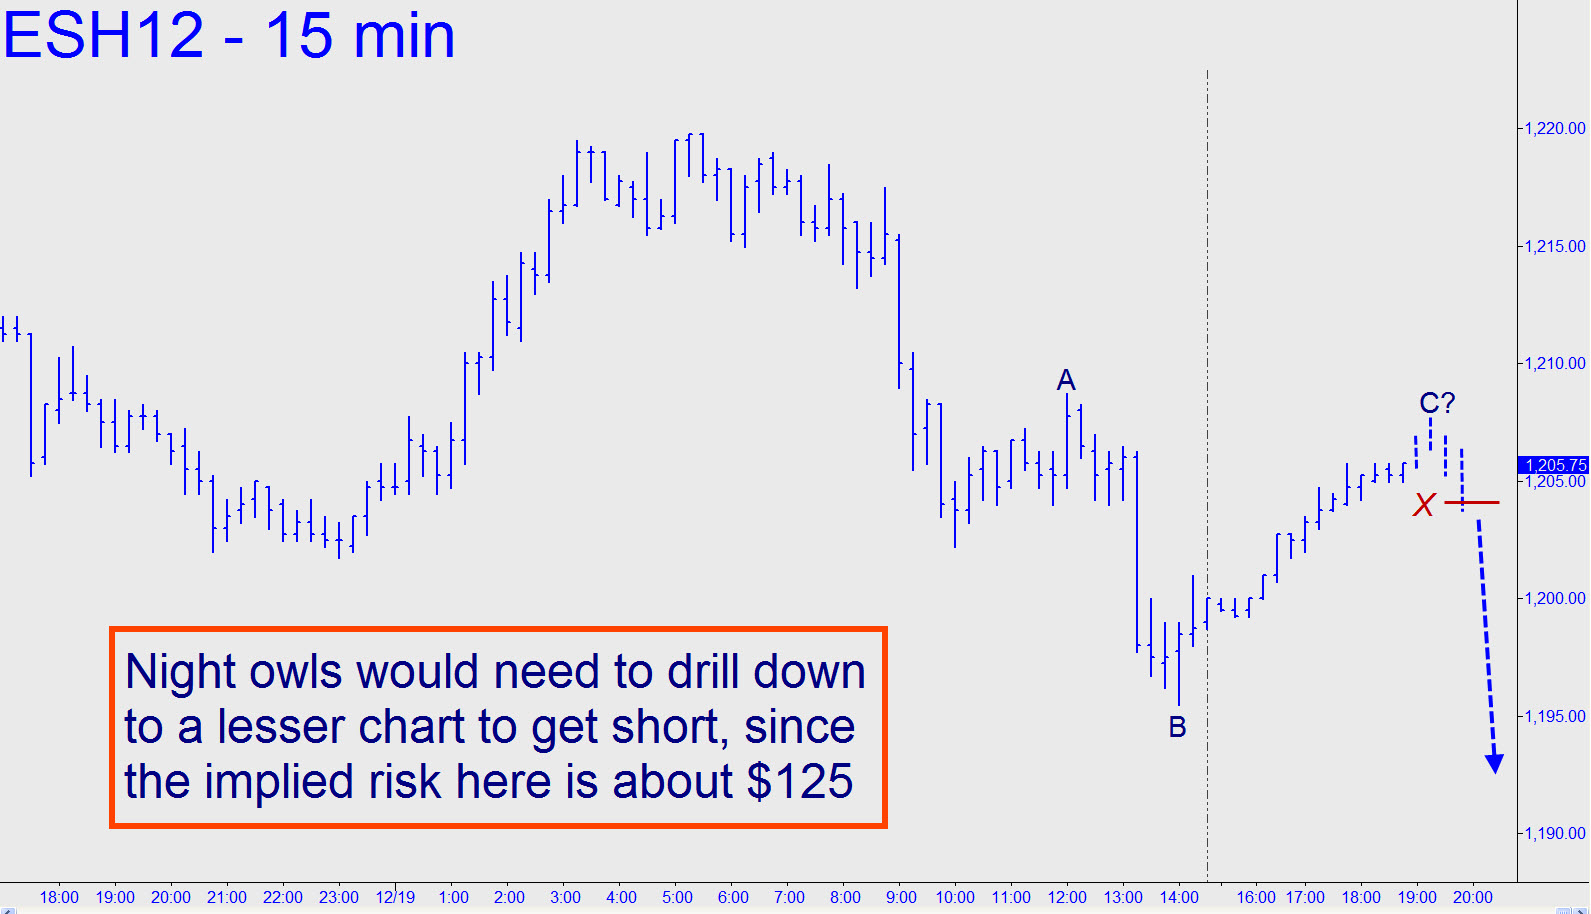
 Someone in the chat room appears to have filled a bid down around 1196.50, a Hidden Pivot highlighted during Monday’s impromptu online session. Although I’m not going to track the position because the trend is too well developed, perhaps we can try to get short when buyers run out of steam. We haven’t done much of this, mainly because it’s been easier to nail swing lows that go against the trend in a presumptive bear market. For starters, let’s use the point ‘X’ of the downtrending pattern shown to get aboard. Entry will need to be via camouflage, though, since the implied theoretical risk here is about 2.50 points, or $125. As I explained during yesterday morning’s sessions, we want to “do” the trade in whatever time frame yields a downtrending abc pattern with no more than five ticks ($62) of entry risk from point ‘X’. I’ll establish a tracking position for your further guidance if there’s an entry signal that meets all of our criteria. _______ UPDATE (10:02 a.m. EST): Today’s wicked upthrust has caught shorts with their pants down. The proximal cause of this squeeze is an apparently successful auction of Spanish debt and an uptick in housing construction. Interestingly, the uptick is mainly in multifamily apartments, implying that the powerful bull market in residential rentals is starting to heat up — to get legs, even. Technically speaking, the short squeeze is bullishly impulsive on the hourly chart and could go all the way to 1240.00 before hitting a Hidden Pivot impediment (A=1177.25 on November 30, B=1266.00 on December 8 = 1240.00 ‘p’).
