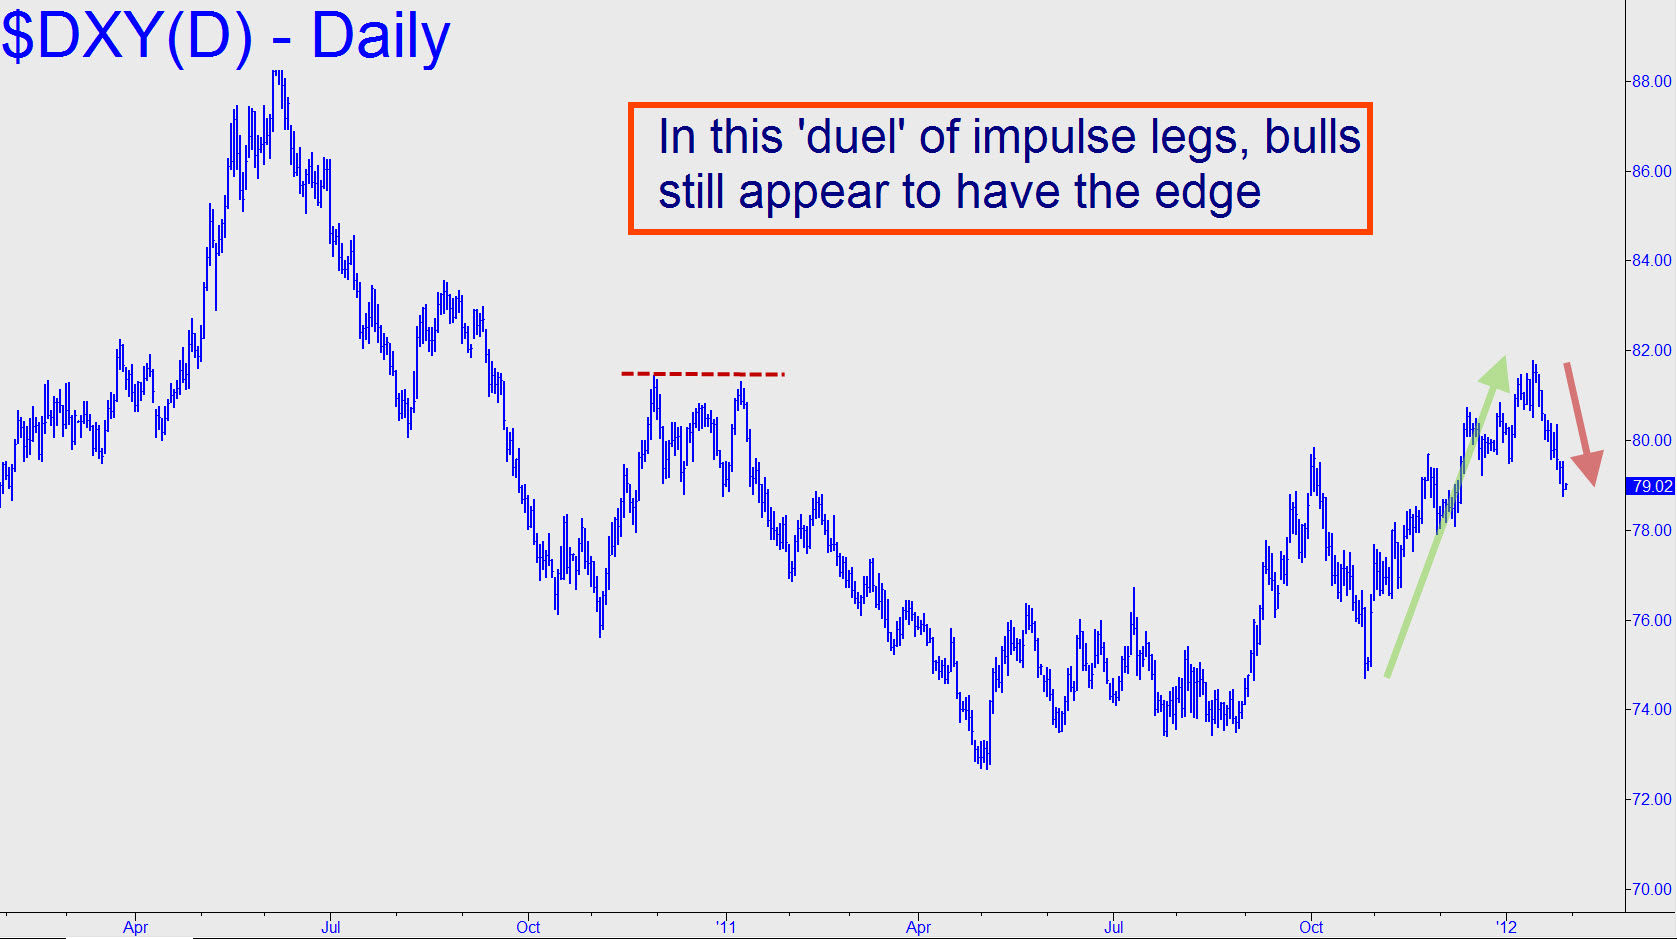
 Some are saying the dollar has seen its highs. But on what evidence? Although it’s true that the selloff from mid-January’s 81.78 high has gone bearishly impulsive on the daily chart, the down-leg must be weighed against a “dueling” bullish impulse leg from 74.72 begun in October that looks more powerful. We should reserve judgment about the outcome pending a test of the 78.18 HP support of the pattern A=81.78 (Jan 13), B=79.60 (Jan 23). The A-B impulse leg is ersatz because it failed to exceed a required second prior low, but it’s real enough that we should expect the target to produce a tradable bounce.
