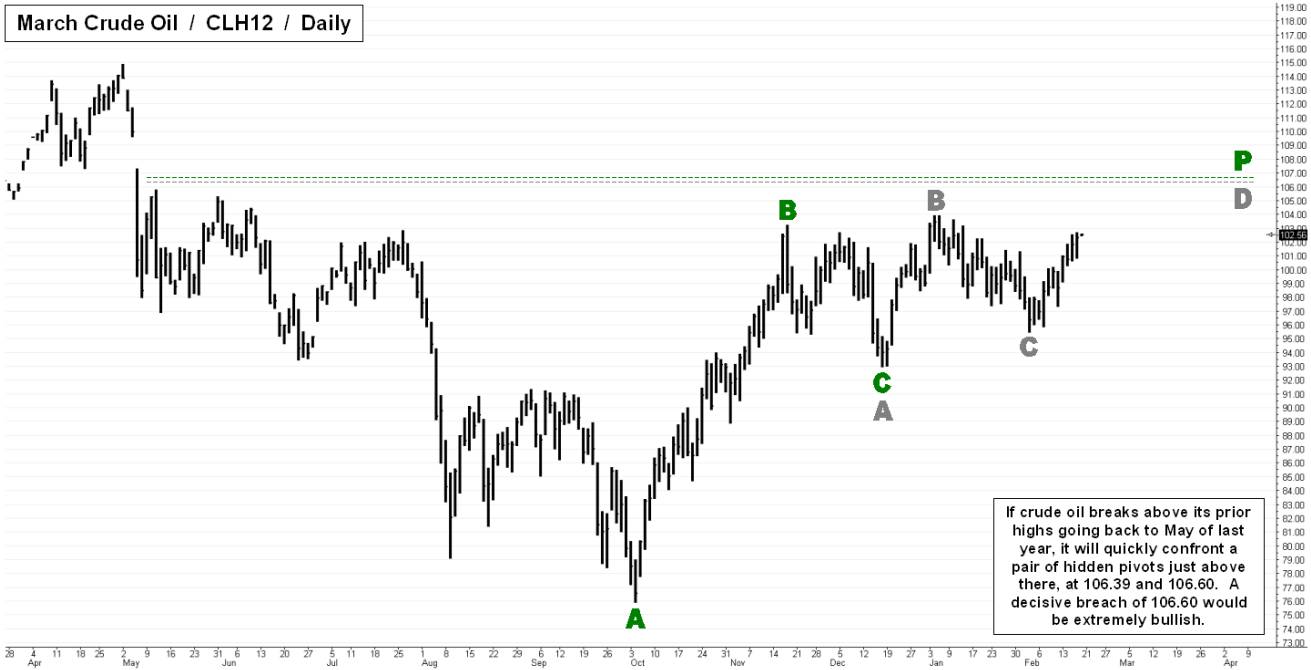
 The crude oil market has a well-defined resistance area between 103.90 and 105.80, with a pair of hidden pivots just above there at 106.39 and 106.60. The late-2011 decline to 74.95 was the biggest pullback in the oil price since its historic post-bubble low. A very fast rebound from 74.95 to 103.37 has been followed by sideways consolidation. A number of prior highs ranging from 103.90 (the grey “B” on the attached chart) to 105.80 (in May of last year) establishes a strong area of resistance. Just above that range are hidden pivots at 106.39 and 106.60. If the oil price can breach the 106.60 pivot decisively, we might infer that it is on its way to challenging the post-bubble high of 114.83. That will leave the all-time high of 147.27 as the only upside milestone remaining to be surpassed. Oil bulls should look for camouflaged buying opportunities. (Posted by Doug “harry” McLagan) _______ UPDATE (2:25 a.m. EST, Feb. 21): The pivots which correspond to the ones highlighted in this tout are at 106.64 and 106.72 for the April 2012 contract, which is now the front futures contract for crude oil.
