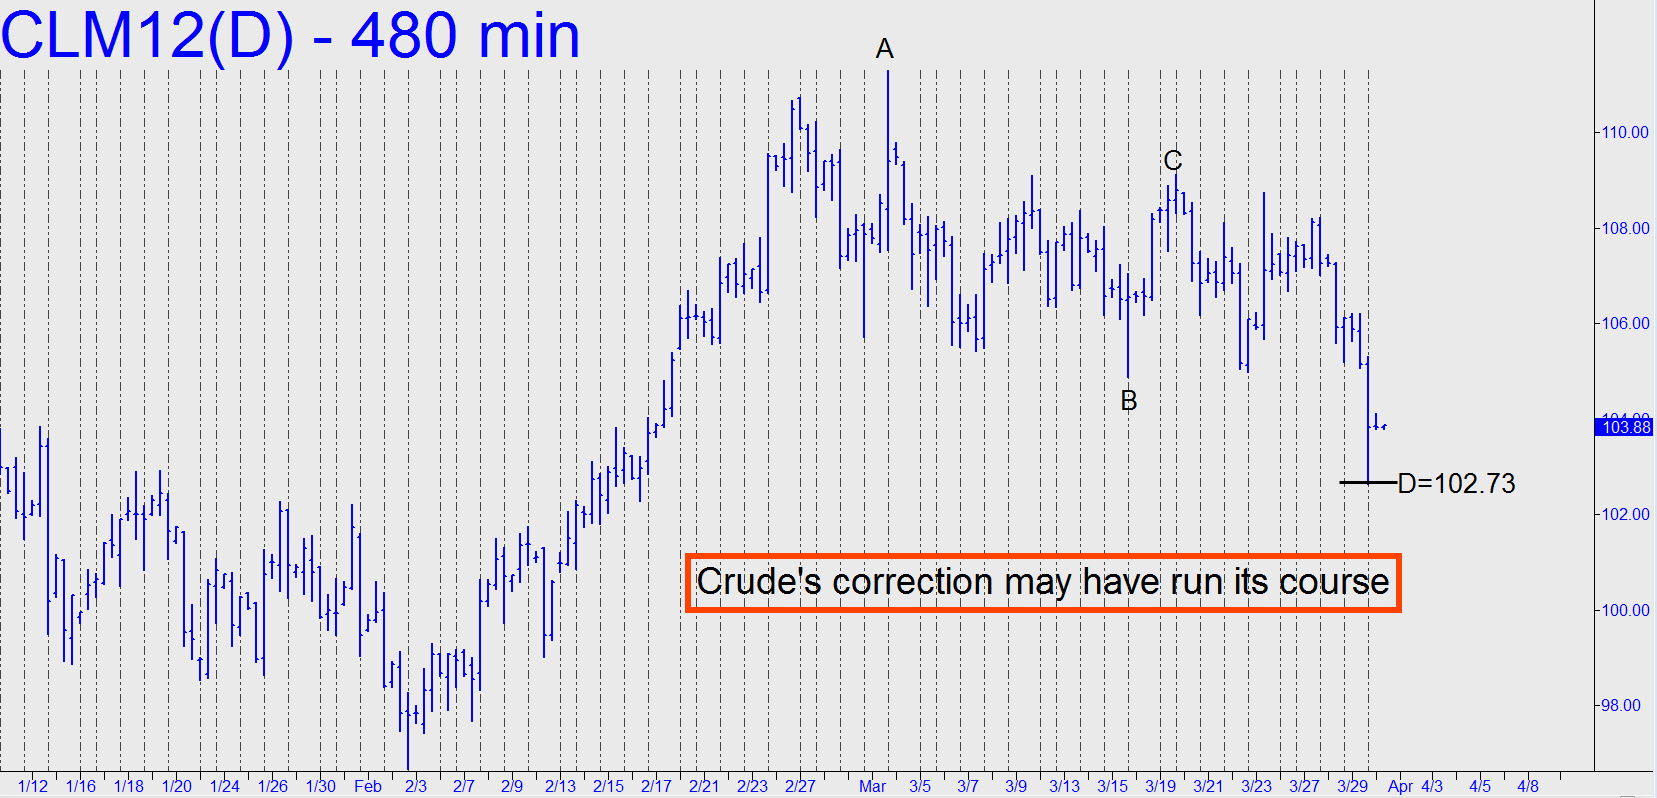
 The correction may have run its course, since the intraday low came within 8 cents of the 102.73 target shown (see inset). For camouflageurs looking to get long, the five-minute chart is where you should focus. Call one up and notice the series of external peaks made Thursday on the way down, each of which could conduce the B-C pullback that would be needed to climb aboard. Alternatively, a relapse would find presumably tradable support at the 102.46 midpoint of the pattern A=105.97 (3/20, 9:40 a.m. EDT), B=102.65 (1:50 p.m.), and C=104.12 (10:50 p.m.). _______ UPDATE (Monday, 12:19 a.m. EDT): The futures died in mid-flight, creating a downtrending pattern with a midpoint support at 102.98 that we can use — and bottom-fish via camouflage — as a minimum downside target for the near term. Please note, however, that a bigger picture begun on the hourly chart on 2/10 with A=99.60, remains bullish on the hourly chart on 2/10 and projects to as high as 115.
