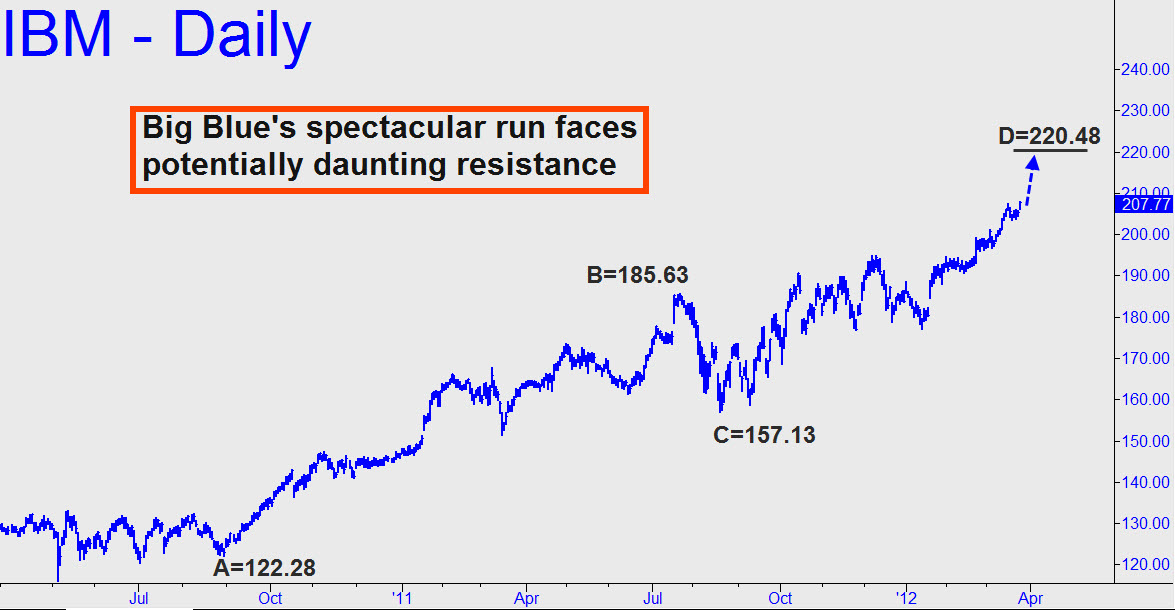
 We have only praise for IBM, a corporate giant that has long shown a knack for doing things right. Technically, however, the stock’s spectacular run faces a potentially daunting challenge not far above in the form of a 220.48 Hidden Pivot resistance, or perhaps at 226.76 if any higher. Long-term investors should consider covered-writing their shares if Big Blue approaches the target range. More immediately, with 13 points of short-term upside potential, camouflageurs should look to leverage any subtle opportunities that arise to get long. _______ UPDATE (April 5): Having achieved no higher than 210.69, IBM went bearishly impulsive Wednesday with a gap-down opening on the hourly chart. Not very pretty. The bigger picture is still bullish, but this week’s miserable price action should be regarded as a shot across the bow.
