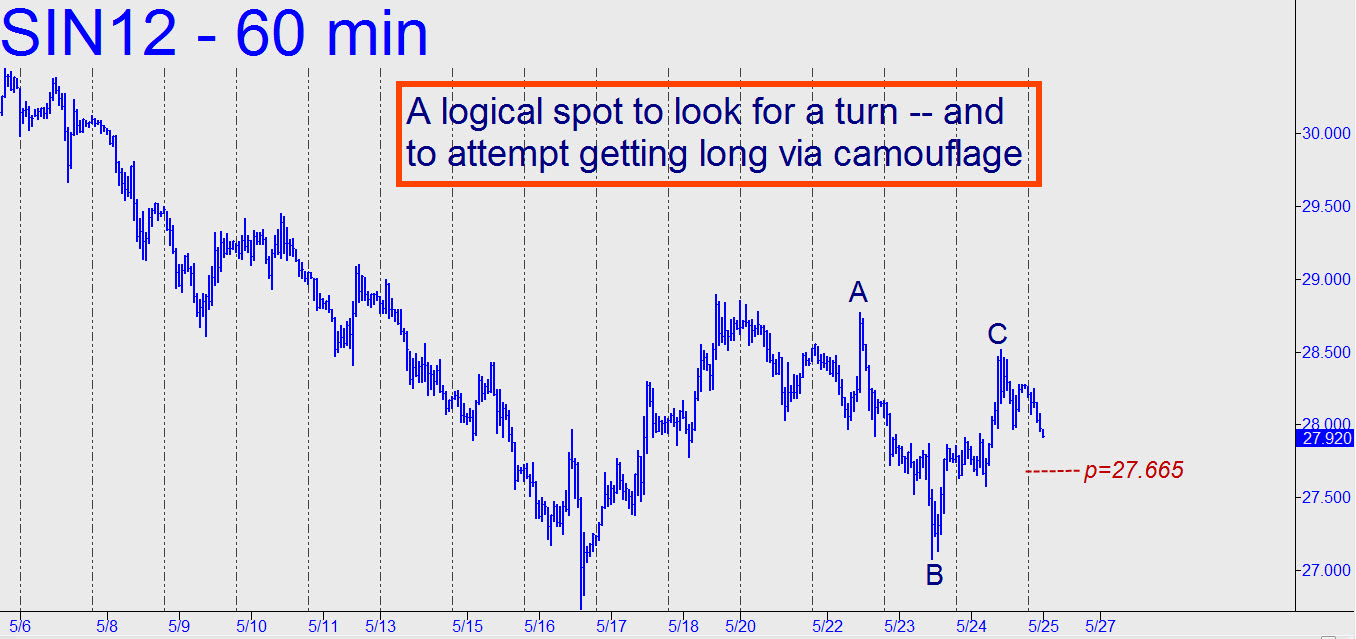
 Based on the hourly chart, I give bears a slight short-term edge in the duel of impulse legs that has played out during the last week. However, if bulls are going to regain the offensive, we should see a tradable low occur at exactly 27.665, the p midpoint of the minor downtrend shown in the chart. You can bottom-fish two contracts there with a stop-loss as tight as three ticks, but if you use ‘camouflage’ and are able to identify an entry opportunity with no more than $70 of risk per contract at entry, you should go for it. If the long position survives the night (or perhaps morning) and at least two subscribers report having done the trade in the manner suggested, I’ll establish a tracking position for your further guidance. In any case, half the position should be exited at the p midpoint of the small ABC pattern used to make entry. ________ UPDATE (May 28, 11:51 p.m. EDT): The futures have suspiciously failed to surpass any external highs in ultra-thin, post-holiday trading. If they should surprise with an upthrust, however, the first hidden resistance where we should look for a stall lies at 29.245 (60m, A=26.730 on 5/16). A decisive breach would imply bulls are gaining sufficient strength — a possible enticement to alert camouflageurs (as well as a shot-across-the-bow of venturesome bears).
