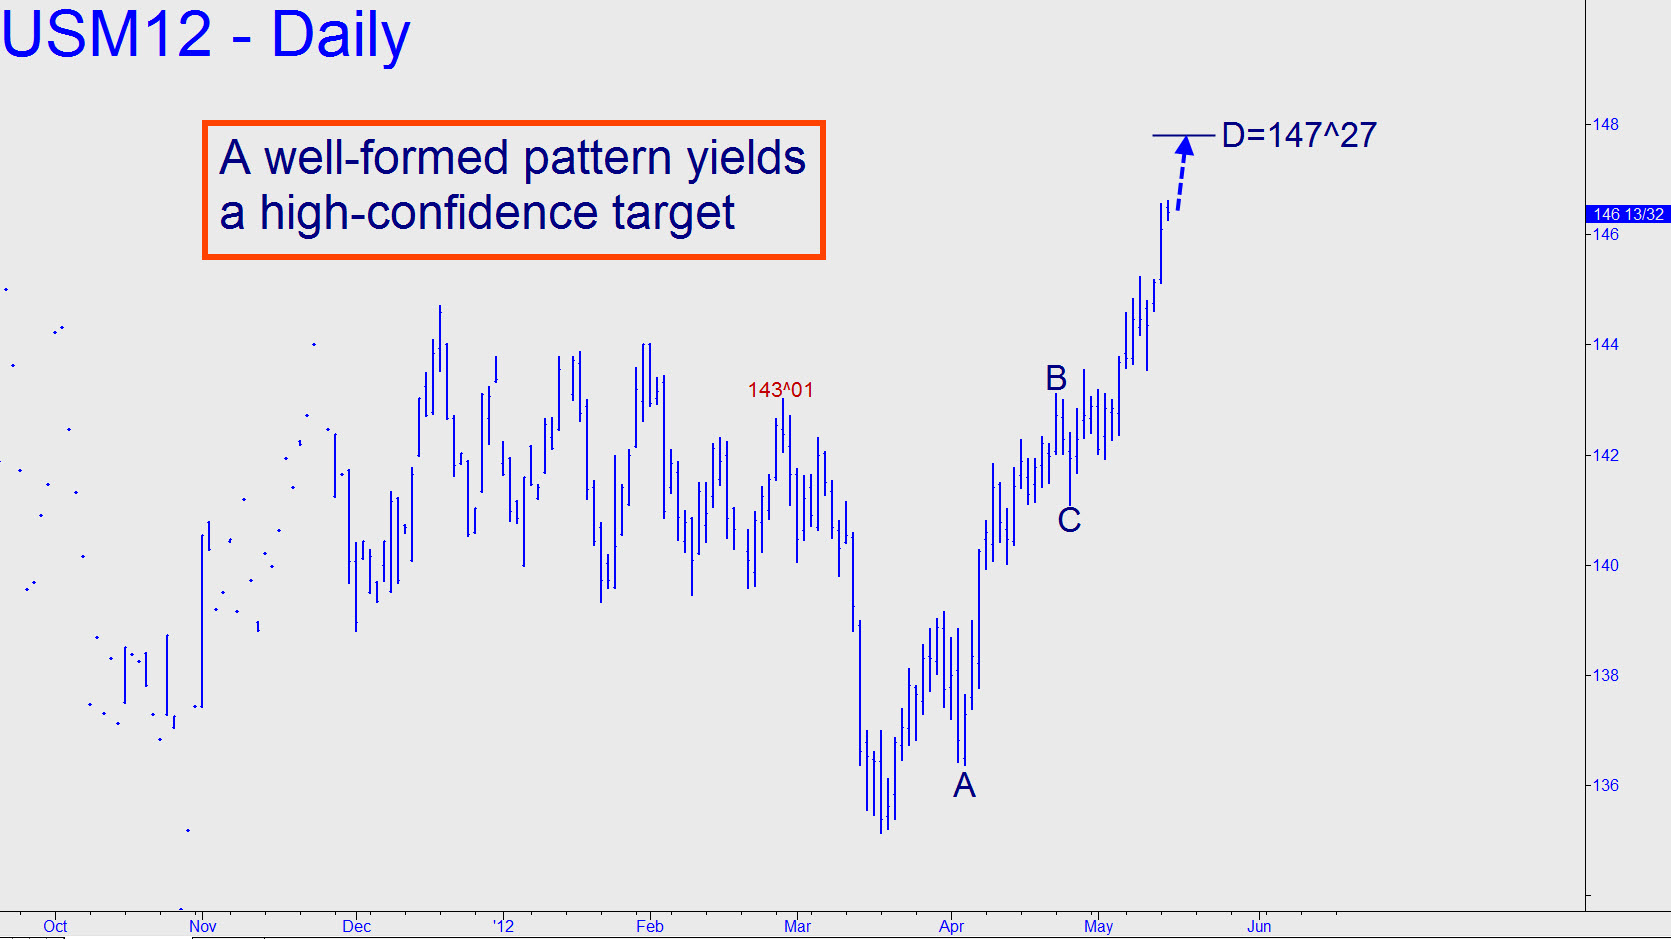
 I’m now projecting a minimum 147^27, based on a rally pattern that has a quite few things going for it. For one, the point ‘B’ high narrowly exceeded February’s 143^01 peak, legitimizing the impulse leg; for two, the B-C pullback is sufficient to have recharged the futures for a successful thrust to ‘D’; and for three, the ‘A’ I’ve used is nicely one-off. Getting aboard for the last piece of the ride will be catch-as-catch-can, preferably via camouflage, but shorts can use a 147^26 offer and a three-tick stop-loss (although camouflage is again the preferred way to initiate the trade).
