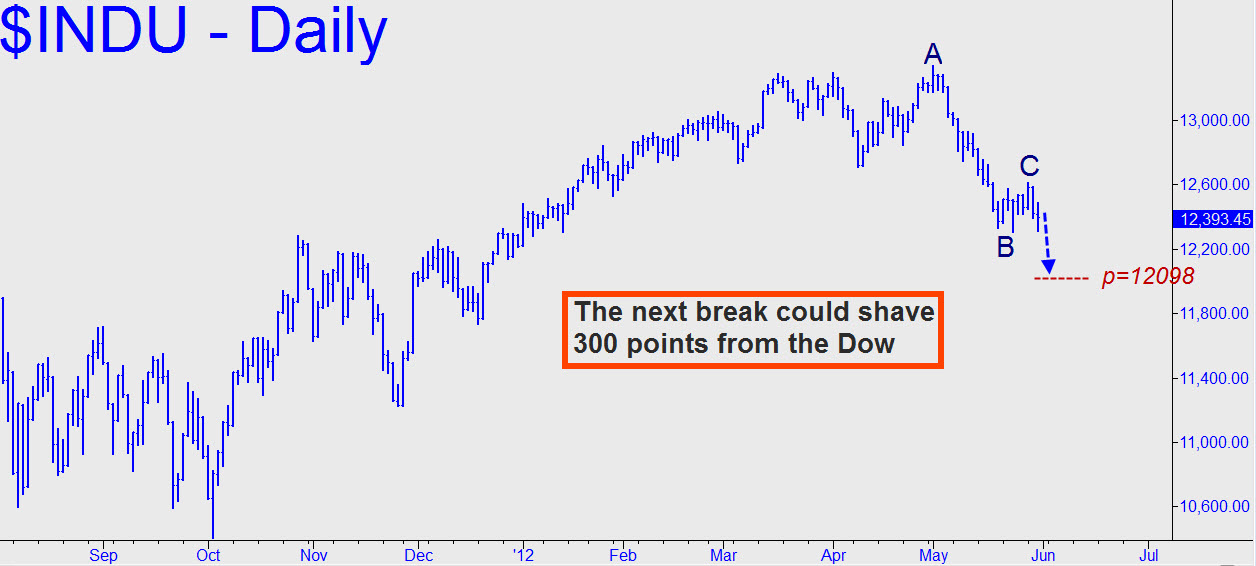
 After May’s hellish, thousand-point slide, the broad averages have been doing their best to test the patience of bears who thought life would be easy once stocks began to fall in earnest. In fact, after two weeks of feints, dives and half-bounces, traders’ patience may be starting to erode. This could provide fuel for one last head-fake, but once it’s over, the Indoos will find it difficult to avoid fulfilling the C-D ‘destiny’ of the initial, impulsive breakdown. There’s also the possibility that they’ll fall straightaway, no head-fake. If this should occur, we could look for the initial plunge to come down to at least 12153, the p midpoint of the pattern shown. _______ UPDATE (June 3, 4:14 p.m.): The Dow shredded the midpoint support noted above so effortlessly that further slippage to its ‘D’ sibling at 11585 now appears likely. More immediately, the 11954 target of a lesser pattern (5-min, A=12490 on 5/31 at 3:40 p.m. EDT, B=12191 on 6/1 at 10 a.m.) can be used not only as a minimum downside objective for the near term, but also as a benchmark by which we’ll be better able to judge the level of fear in the market. (Of course, it can also be used to bottom-fish or to take profits on an existing short position.) An easy breach of this Hidden Pivot support would be warning of panic selling to come. Alternatively, bulls would need to muster a thrust to at least 12724 over the next couple of days to mount a credible recovery. UPDATE (June 7, 10:03 a.m. EDT): Set a screen alert at 12722.64, since that’s when this so-far hoax-of-a-rally would become semi-legitimate. That’s a tick above a look-to-the-left peak recorded on the opening May 16. _______ UPDATE (June 13, 7:30 p.m. EDT): The hourly chart has gone flat, with dueling impulse legs now signaling perhaps a few days of trendless grinding with no net gain or loss. Under the circumstances, traders might do well to confine their ambitions to the very lesser charts.
