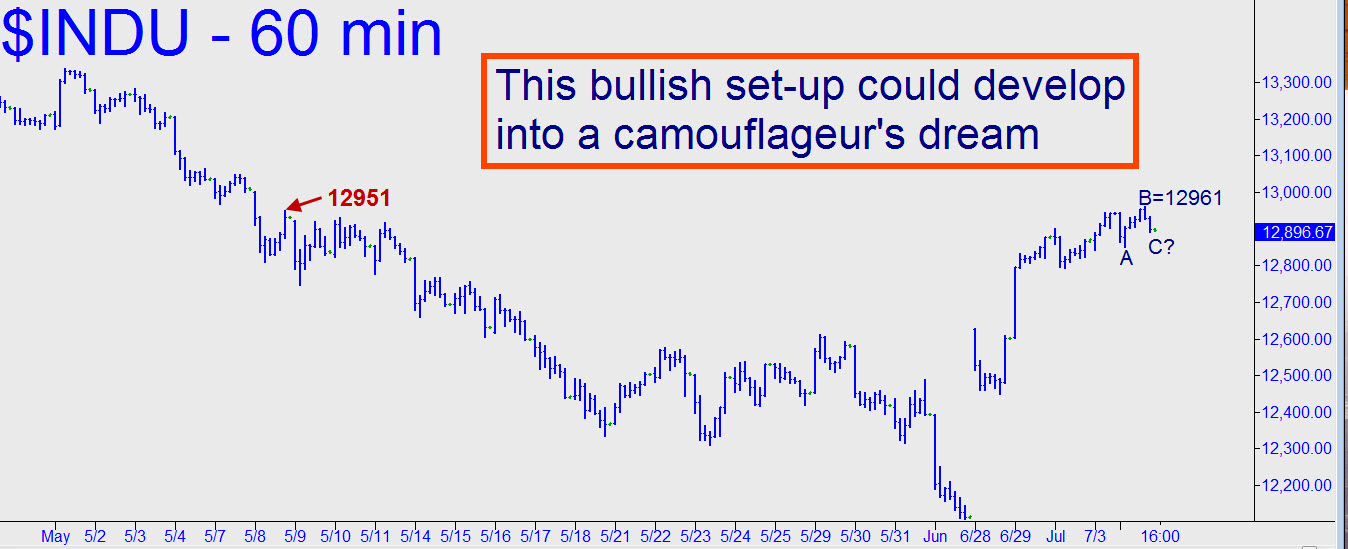
 If you’re looking for good reasons to be bullish right now no matter what the news, check out the well-hidden impulsiveness of the Dow’s hourly chart. The pattern shown is a dandy — as persuasive as it is subtle — for camouflageurs seeking to get long. A point ‘C’ low has yet to become manifest, but if and when it does via the creation of an ‘x’ entry signal, I’d suggest using the first uptrending abc pattern you can find on the three-minute chart to get aboard in the Diamonds or another comparable vehicle. _________ UPDATE (12:09 p.m. EDT): It’s fascinating how quickly an incipiently bullish picture has turned bearish now that today’s nasty downdraft has negated the ABC rally I’d sketched hypothetically. The hourly chart now reflects a duel that bears are winning. Although the larger ABC rally going back to A= 12480 on June 28 is still intact, the fact that it took two running starts to get past two sets of ‘external’ peaks recorded, respectively, on May 8 and May 10 tells. If the current selloff reverses to produce a nice point ‘C’ low, we’ll want to short the midpoint very aggressively, for it would be a logical place for a bull trap to get sprung.
