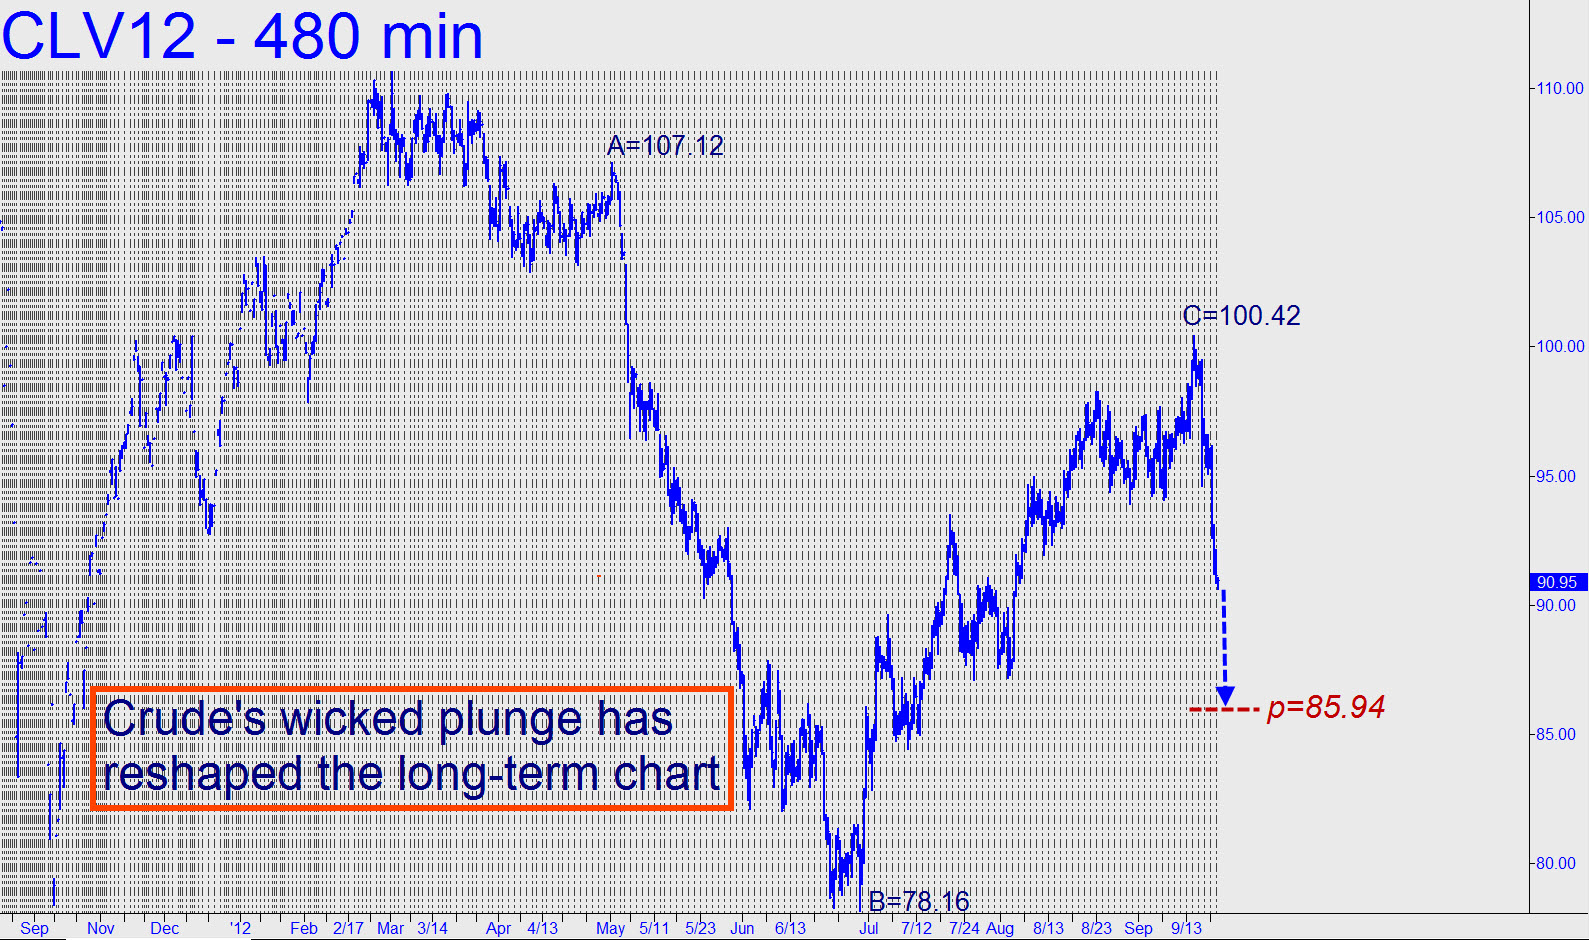
 We needn’t join the panicked, confused and vexed trying to figure out what caused Monday’s dive, since it left a guileless impulse leg on the hourly chart. The midpoint support lies at 94.79, exactly 32 cents beneath yesterday’s low. That number should serve as a minimum downside target for the near term, but if it’s breached by, oh, more than 25 cents, we should expect more weakness to the ‘D’ sibling at 92.36. Use the 5-minute chart for camouflage if you attempt to get short — but also for bottom-fishing at either ‘p’ or ‘D’. Keep in mind that even the most fetching patterns in this particular vehicle require a margin of error of at least 21 cents. _______ UPDATE (September 20, 3:40 a.m.): The collapse from Friday’s 100.42 high has gone far enough to give predictive form to the large, bearish pattern shown. It’s p midpoint support lies at 85.94, and so we’ll use that Hidden Pivot as our minimum downside objective for now.
