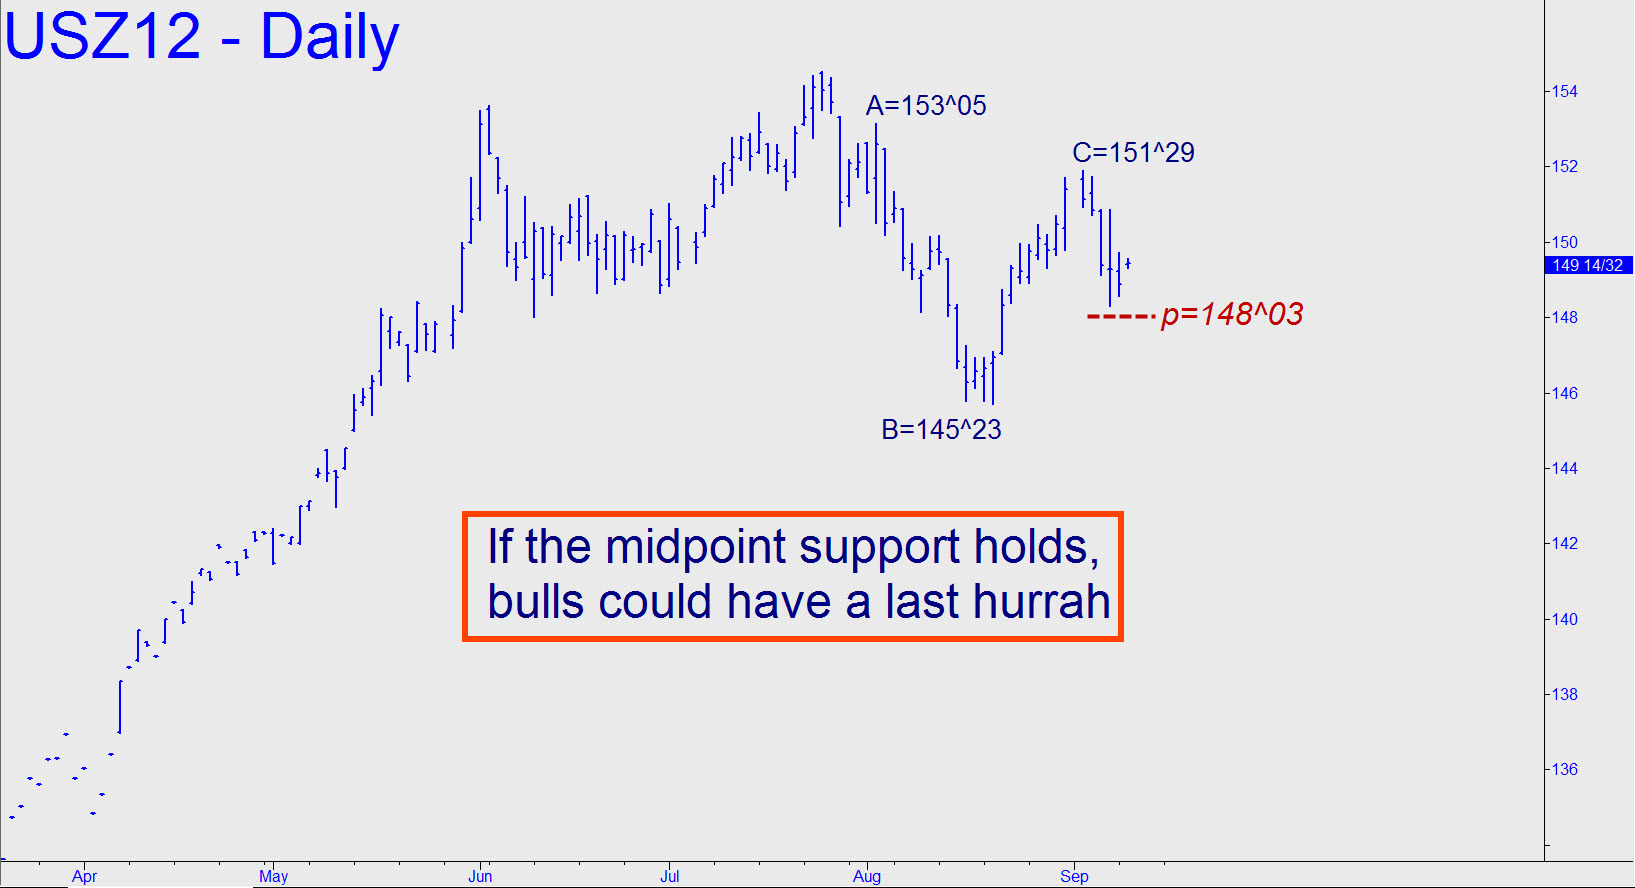
 T-Bond futures are at key threshold after breaking down in mid-August. A strong rally has ensued, creating a ‘duel’ on the daily chart between bulls and bears that currently favors the latter. That would change, however, if buyers get traction at or above the 148^03 midpoint support shown in the chart. This may be occurring now, but it would take a further rally above early August’s 153^05 peak to make it official. Traders can use camouflage to get long by leveraging a pullback from 1-3 ticks above 149^28. An external peak at that price can be found on the 10-minute chart (September 7, 1:20 p.m. EDT). _______ UPDATE (11:22 a.m. EDT): The futures have broken down this morning with a decisive breach of the 148^03 Hidden Pivot support flagged above. This strengthens the evidence that a 30-year bull market has ended. Next stop below: 144^15.
