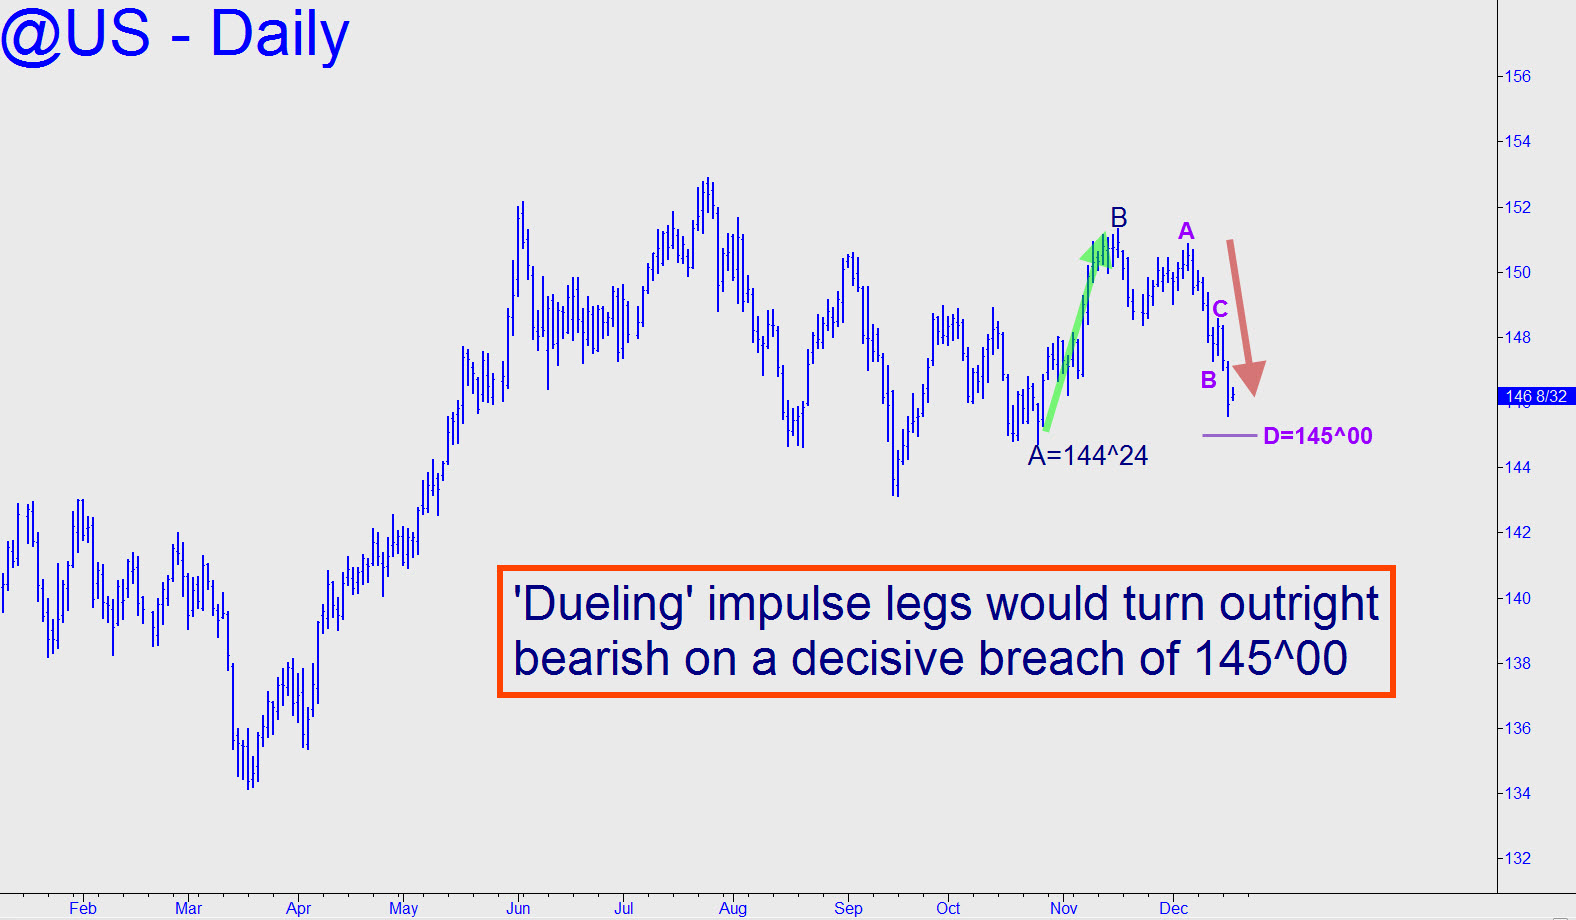
 My outlook for T-Bonds has been bullish for quite a while and remains so down to 2%, but we should nonetheless take note of some bearish impulse legs that have developed recently on the daily chart (see inset). So far, they amount to a mere duel with a more powerful, bullish impulse leg begun from 144^24 in late October. We’ll have a better idea of bears’ earnestness when we see how they interact with the 145^00 downside target of the small pattern shown. A breach of that hidden support by more the 3-4 ticks would hint of more weakness to come, while a breach of the 144^24 low would sent up a warning flare.
