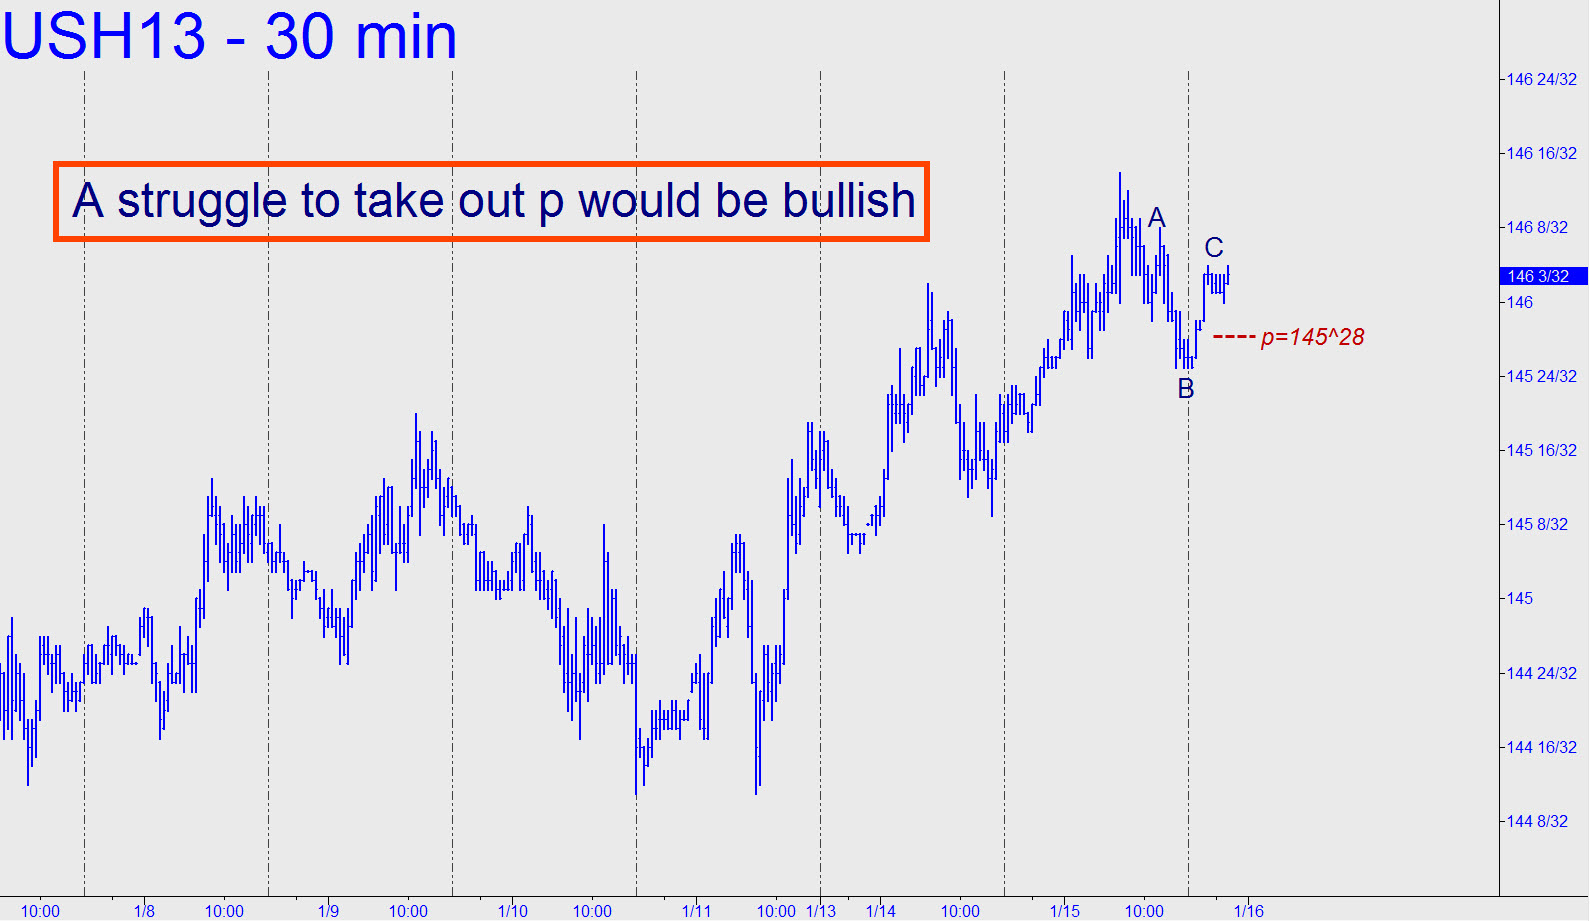
 With much effort, the futures have ratcheted higher since bottoming four days ago a single tick above a 143^16 Hidden Pivot target that had been noted here earlier. T-Bonds are by no means out of the woods, and we cannot rely on the daily chart to tell us when this has changed, since it would take a monster rally to create a bullish impulse leg. Under the circumstances, we’ll have to lower the bar, stipulating that an impulsive thrust on the hourly chart would at least put bulls back in the game. As shown in the accompanying chart, it would take an uncorrected rally exceeding the two labeled peaks. Otherwise, a relapse would likely find support and a tradable bounce from the p midpoint shown. _______ UPDATE (9:35 p.m. EST): The futures flirted with danger, dipping below the 144^16 pivot noted above, and another at 144^14 that we pondered during yesterday’s online tutorial session. It’s do or die here! _______ UPDATE (January 14 at 1:10 a.m. EST): An impulsive bounce from 144^11 has brought respite, if not to say a reprieve. The current rally pattern targets 146^13, with possible midpoint interference at 145^25. _____ UPDATE (January 15 at 11:16 p.m. EST): The futures rallied sharply yesterday to a high at 144^15, exceeding my forecast by a single tick. The 18-tick pullback that ensued is bearishly impulsive on the 30-minute chart (a new one; see inset), but the short-term picture would revert to bullish if sellers have trouble pushing below the p midpoint of the pattern shown.
