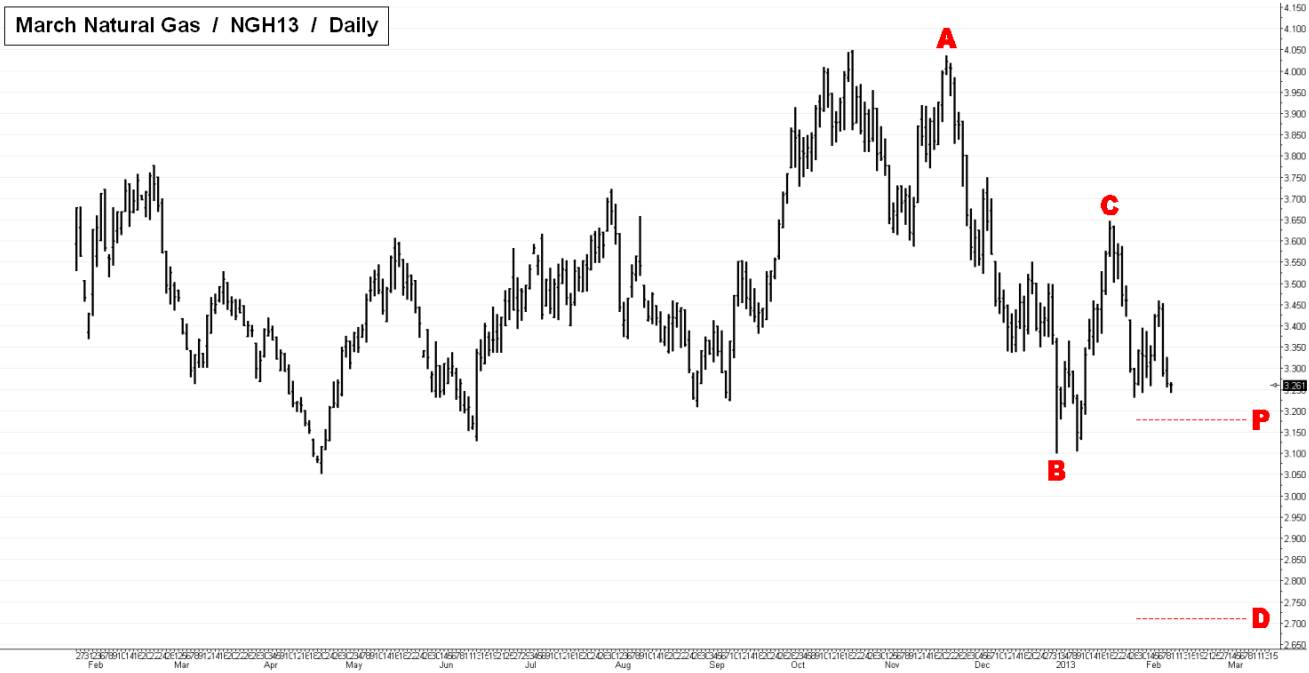
 A classic pattern on the daily March natural gas futures chart gives us a target at 3.178 which offers good odds to bottom-fishers. The pattern began with an ‘A’ point of 4.036 on November 22 of last year, a day when someone was obviously trading futures instead of eating turkey or remembering John F. Kennedy. The sharp decline of almost 25% kept to its holiday theme by bottoming on New Year’s Day, again during electronic trading. A vigorous bounce followed by another decline has moved the futures toward our midpoint pivot, which ought to be given a good ten or more ticks of leeway with a sell-stop, in light of the large size of the pattern. If the market goes very far below the pivot, our method tells us to expect a drop to 2.710, a level that the March contract has never seen. (Posted by Doug “harry” McLagan)
