A Simple Look at Gold’s ‘Technicals’

[NoteAugust Gold’s $23 dive yesterday brought it closer to the 1353.70 red zone identified when the commentary below was published Monday night. The intraday low was 1360.20, but you should keep in mind that the futures would need to close below 1353.70 for two consecutive days to become at least an even-odds bet to fall to a longstanding correction target at 1219.40. RA]

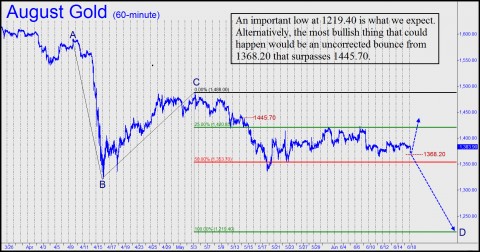
We’ll shun jargon for a moment and make it as simple as we can for bulls who have patiently stood by gold since it began its long dirge nearly two years ago.  Looking at the picture below of Comex August futures, the weight of selling in recent months should be apparent even to those who know nothing about charts. It projects a potentially important low at 1219.40 that would imply a nearly 12% fall from current levels. That outcome, our worst-case scenario for the next 3-4 weeks, would become an odds-on bet if August Gold were to settle for two consecutive days beneath the red line at 1353.70. There would be no guarantees at that point that 1219.40, a major “Hidden Pivot “support, would hold, but we would be prepared to bottom-fish there aggressively in any event, albeit with a very tight stop-loss.  More specifically, we would use our proprietary “camouflage trading” technique to hold theoretical risk as low as possible. If you would like more information about this method, which we use daily to trade and forecast, click here or consider taking a free trial subscription by clicking here.

Looking on the brighter side, the very best that bulls could hope for over the near term would be a strong bounce from 1368.20, which lies just below. Although that number is a minor “hidden” support according to the technical system we use, it is the very first spot at which bulls might hope to find good traction.  Any lower, though, would indicate at least $26 more slippage, to a 1342.00 support that is a “cousin” to 1368.20.

Bears Struggling Too

Another possibility is that the futures will continue top move sideways without breaking significantly higher or lower.  The odds of this would appear to be low, since, as you can see in the chart, bulls have been struggling hard just to stay afloat. It should be acknowledged as well, however, that bears have been unable to push gold lower easily. In fact, they have made zero net progress since mid-April, when August Gold was trading exactly where it is now.

If you want to tune out the noise and set a wake-up call for when “something” happens, we would suggest monitoring price points at 1438.90 and 1353.60. Any rally that touches the first number would generate a robustly bullish “impulse leg” on the intraday charts. If this were to occur within the next few days, starting with a bounce from the 1368.20 pivot noted above, bulls would have reason to celebrate, since a strong impulsive rally will have begun without the corrective downtrend having completed the big ABCD pattern shown. Such a sequence of events, precisely, is extremely bullish according to our runes. Indeed, it is how several bull markets we have observed over the years have begun  — i.e., with an upward lurch from a place seemingly off the radar of conventional support-and-resistance players.

  • James July 2, 2013, 7:15 pm

    I agree on not trsuting the charts as much…as we are in in-charted times (no pun intended) but I am curious about the whole transition into this digital economy. I am a huge supporter of gold and not just paper gold assets but physical gold and bullion. I don’t think we will be able to buy any physical gold after some time. And all this QE mentions from the FED is interesting. What do you all make of this and is it a transition to other currencies perhaps? Bitcoin is scary volatile but looks like a lot are adopting it…

  • KevinR June 20, 2013, 6:51 pm

    I can’t comment for anyone else but myself, but laying it all out there…..
    I bought a lot of my RRSP holdings (ie: gold miners, royalty companies) back in 2008/9. It’s been a rough ride thus far that’s for sure. Was up nicely for a year to year and a half but the last 2 years has been an absolute disaster.

    I still hold all the stuff that I originally bought and overall my account is still worth more than I paid for it (so far). Not a lot more at this point but still up a little. As they say – hind sight is always 20/20.

    So long as I’m O.K after everthying blows up and the smoke clears then it will be all good. In the mean time, it is a tough pill to swollow to see your account go up and then drop in value so much.

    I have ZERO shorts. That’s just me…..

    I thought $1320 may have been the low and would hold but apparently not.

  • Robert June 20, 2013, 4:34 pm

    Well, I gave up this morning. I called my Broker and told him to liquidate my miners and divide half among AAPL, GOOG, and TSLA, and to put the other half in 30 year Treasury bonds

    I leave to take my bullion to the coin store in about an hour…I’ll take the proceeds from that in cash and hide it under my mattress.

    I can’t “lose” any more.

    You guys and your charts crack me up. You all “see” the trend moving to some arbitrary number, but never give any andication about what to do once it’s there.

    In other worlds, every one of you on the 1150 Gold band wagon have merely stated that once at 1150, you will take ANOTHER look at the charts and decide what to do at that point, without stopping to think that the market will be telling each of you the same thing at that point (just as it is telling you right now that 1150 is the “obvious” next stop).

    I want to know SERIOUSLY, and HONESTLY, how many of you are carrying a strong net short position in Gold right now, with no intention to cover until it reaches 1150…?

    How many of you are included in the COT’s Small Spec Short category right now (which is at record high levels, and building higher every week; just as the long commercials are net long, and are building greater long exposure every week) ?

    If you are short, then you are sitting in a movie theater, relying solely on your confidence that you will smell the smoke and hit the exit before anyone yells “FIRE!”

    When “technical” price targets appear obvious, that is not a product of your mythical insight. Markets are designed to separate you from your capital. Every technical target is a fake highway tunnel painted by the road-runner on the side of a rock wall…and all of you play the part of the Coyote.

    I wish all of you the best of luck. Meanwhile, I (finally) am seeing the mother of all low risk, low margin opportunities to actually employ leverage against the current trend.

    I prefer to focus on the psychology of market participants, and right now, the precious metals markets are loathed by Wall Street- I mean, vehemently hated. If you are a Hedge Fund Manager, then you are neutral to net short the PM market.

    And all you independent traders out there are betting on the hedge funds being right.

    The set up is perfect for Wall Street to be wrong, just as it is about 3 times per decade. And what can happen when Wall Street is wrong?

    1987
    2002
    2008

    Or, maybe this time the Fed REALLY ACTUALLY SERIOUSLY FOR REAL means it when it says it will stop blowing up its balance sheet, and Zappa’s curtains will be drawn and we will all (finally) learn that New York really IS the actual capital of the US, and that Washington yields to New York’s bidding.

    I am so stupid, that I am going longer and longer as the discount bargain sale of the decade continues…

    I hope you are all correct with your 1150 call.

  • KevinR June 20, 2013, 2:10 pm

    Well, I guess there is no doubt now that gold is headed to at least $1219 in the short term (and likely $1150).

    Hopefully that will be the low and a good time to buy because I have a bunch on monopoly $$$ to get rid of.

  • Dave June 20, 2013, 3:27 am

    Sorry, FULL is confusing.

    Mercury goes Retrograde on 6/26.
    We are now in (fore)shadow period, which can suggest what may come.

    Generally Mercury Retrograde does not imply a stock, commodity trend, other than likely increased price swing action, up and/or down. A financial astrologer would have to look at a specific stock first trade chart to give indepth guidance.

    Gold today/night has moved significantly down, foreshadowing a possible further down trend that Rick has touted and commented on. We’ll see tomorrow if Gold closes below Rick’s 2-day 1353.70 though it has already tonight broken the 1342 support (1,338.60) Rick also commented on.

    Gold could also rebound higher per Rick’s HP targets before returning even lower. Rick wrote a worst case scenario for next 3-4 week period, which coincides during a Mercury Retrograde. Expect larger swings.

    The shadow period is before the retrograde, when Mercury is in degrees that will be part of the cycle. The release period is when Mercury is out of retrograde degrees completely. The shadow time is one of foreshadowing; the days up to the release bring many ah-has.

    June 26 to July 20, 2013
    • Shadow: 13 Cancer, June 10th
    • Retro Station: 23 Cancer, June 26th
    • Direct Station: 13 Cancer, July 20th
    • Release: 23 Cancer, August 4

  • Dave June 20, 2013, 2:09 am

    One old stuff phenom still works… Mercury Retrograde shadow period began 6/10/13, Mercury goes FULL retrograde on 6/26/13 through 7/20/13 then goes shadow again until 8/4/13.

    All phases are in Cancer, moving between 11 degrees through 26 degrees. Anyone who is Cancer or has Cancer as their rising sign/ascendant, may feel the effects greater than most others especially if their natal Mercury is within these degrees. So far past week, a Cancer friend had a TV blow out, another Cancer friend found out their Cancer cat has terminal eye cancer.

    TSLA was “born” (first traded) a Cancer with Mercury at 9 degrees. There should be some noticeable volatility though not as severe since it’s 2 degrees away from a direct hit. Mercury, known as Quicksilver, generally speeds things up. Will TSLA reach an all time high?

    Past MRs have pushed gold, silver to all time highs, minor and THE major flash crash, AAPL reached a then all time high on way to current all time high a few weeks later. Larger swings and volatility have already shown up since 6/10.

    General advice is lay low, try not to begin major projects nor sign major contracts, backup computers, double check travel plans. Don’t get upset if things get delayed. One may find people from their past reappear and issues that began during a past retrograde resurface.

    Enjoy! 😉

    • gary leibowitz June 20, 2013, 2:27 am

      “Mercury goes FULL retrograde on 6/26/13 through 7/20/13 then goes shadow again until 8/4/13. ”

      How does that translate into stock trends? Full retrograde means higher or lower in that time frame?

  • dst June 20, 2013, 1:22 am

    Why waste time reading those reports, just do the tech. Armstrong whom is the best in the world by far is getting it right all along. Keeps me out of trouble the past 8 months or so. The COT has been bullish many $ higher. Trader Dan says forget that for now means squat.One day it will be right. Just like the letter writers whom call a bottom every 6 weeks for the past two years. Really sad in fact. Once “everyone” turns bear (capitulation) then move in.

  • Andrew Gutterman June 19, 2013, 11:57 pm

    On Stockcharts.com $Gold is sitting on a slightly upward sloping trendline formed by the lows in April and May. Should it break to the downside, watch out below!

    Andy

  • gary leibowitz June 19, 2013, 11:15 pm

    Gold just broke below support. Lets see if it holds tomorrow. Like clockwork the Fed’s no new news today created an opportunity to sell equities. Lets see how far this “correction” takes us. Ben said absolutely nothing new, yet a repeat of the same past statement seemed to have people finally believing he means business. He did indicate it will not happen till end of this year, so the timeframe seems established (assuming his anticipated economic recovery stays on track).

    I am inclined to think Gold just might swoon tomorrow another 25 dollars or more.

  • dst June 19, 2013, 7:19 pm

    How do you know JPM is long gold? And how do you know it is not for their clients? and how do you know if they are not short gold stocks?

    • Robert June 20, 2013, 12:17 am

      Read the CME’s monthly bank participation report.

  • Israel June 19, 2013, 4:51 pm

    JP Morgan is major long gold now. I’m not bettin’ against ’em.

  • gary leibowitz June 18, 2013, 9:53 pm

    Interesting take on Gold. I too am convinced the price is going to hit 1200 soon, perhaps within days, if not weeks. I also find the May 21st equities top might hold after all. It looks like a long consolidation or topping pattern of some 2 plus weeks down and 2 plus weeks up. That would mean the stock market could spike over next few days, and cause gold to hit its bottom.

    I do not see another 1500 DOW move higher from here. The visual chart pattern shows 5 waves followed by an even steeper 7th wave up from April 18th to May 21st. That usually suggests a terminal move. Since 80 percent of all terminal moves is followed by a drop and subsequent rally nearing the old highs, we might be experiencing one develop right now.

    It makes sense that we get a spike in equities and a sharp drop in gold nearing a trend reversal of both.

  • KevinR June 18, 2013, 5:29 pm

    When your $1150 target is hit Andrew, what do the charts then portray?

    • Andrew Gutterman June 19, 2013, 4:36 am

      Don’t know. Hasn’t gotten there yet. When it does and I see a pattern I “might” be able to tell you something. This isn’t like Hidden Pivot. Just simple charts.

      Andy

  • Dave Bellamy June 18, 2013, 5:10 pm

    Hi Andy,

    How did you get your $1150 target?

    I have had several downside targets for gold and I can see the sense in Rick’s target of $1220. I can also see potential targets in the 1100s as well as targets of Fibonacci retracements of the entire bull market (from $253 to $1920) which go to $1284, $1087 and $890 (which is coincidentally where gold futures topped on 21 January 1980).

    Simper measured moves from the trading range which was $1800 to $1520 or so woulkd give you the $1240 target or the trading range from the top at $1920 down to $1520 would give you an $1120 target once $1520 was broken. Taking daily closes instead of intraday highs and lows might give you a little bit above that – is that where you got $1150?

    All are lower than where we are right now. As I write this, Rick’s 1368.20 number is broken and the price is 1365. $1220 looks likely now but it might be a fake move, because we get so many.

    Has anybody noticed how the current Dow and S&P 500 charts look like the gold and silver charts going into early 2011? Multiple tops followed by a huge breakout? Three peaks and a domed house and all that? There is a fairly uncanny (but not total) resemblance – and what happened to gold and silver once those patterns were completed? Any comments, Rick?

    • Rick Ackerman June 18, 2013, 10:36 pm

      Your analysis is more detailed than my deliberately dumbed down version, Dave, but I wouldn’t argue with any of your conclusions. However, and as was stated explicitly in today’s commentary, I will require a two-day close below 1353.70 (basis Comex August Gold) before inferring that a further fall to 1219.40 is at least an even-odds bet. So far, the low on August Gold is today’s 1360.20, the nadir of a $23 drop.

      Regarding the broad averages, the four-year bull has rewritten the rules so that none of the old stuff works: not conventional patterns like H&S, domed houses, teacups; nor lunar cycles/spiral calendars; not permabear standbys like the Hindenburg indicator; nor overbought/oversold or highs/lows oscillators. Of course, Elliott Wave Analysis is guaranteed to work — provided one can correctly identify and rank dozens of corrective patterns within a Byzantine hierarchy of larger, impulsive patterns going back to the 1700s.

      That’s why I like to keep it as simple as I can, using the Hidden Pivot Method. It currently calls for a major DJIA top at 16800. Because I cannot believe this in my gut, not even a little bit, I’ve been monitoring the charts closely for the subtlest sign of a downturn. In theory, at least, someone using this easy-as-abc method cannot miss the top of a bull market as long as he is monitoring abcd patterns on the lesser charts. It is a truism that every bull market must end — and bear market begin — with a downtrending abcd pattern on the one-minute chart. That explains why it’s at least theoretically possible to get short within ticks of the very top of a bull market without knowing for certain that you have done so.

      At this stage, if minor abcd corrections start overshooting their ‘d’ targets, that would be a red flag that a bear market already begun is starting to snowball. ‘Fractal’ price action on charts of various time frames makes it possible to discern in the very smallest patterns clues about the health and life expectancy of much larger patterns. A specific corrolary that underlies Hidden Pivot Analysis is that healthy bull markets are not supposed to produce corrections that exceed their ‘D’ targets; rather, the corrections should go only to the midpoint of the c-d leg before reversing upward.

    • Andrew Gutterman June 19, 2013, 4:33 am

      I’m an old-fashioned technical analysis kid of guy. My bible is Technical analysis of Stock trends by Edwards & Magee. 7th edition on my bookshelf.

      Go here:

      http://www.booktrakker.com/Avocado/Gold.jpg

      Standard descending triangle. Measure from the top at 1920, subtract the horizontal support at 1535 to get 385. Subtract that from 1535 to get 1150.

      About as simple as one can get.

      One can also draw a symmetrical triangle and get about the same target.

      I remember doing these charts programmatically on an Apple II+ computer in the early 80’s, using a program I wrote. Given any set of data you could run the program and it would draw triangles, rectangles and whatnot, automatically. We did a demo for S&P who claimed it was impossible to do that on a computer with only 64K of RAM, no hard drive. Couple of floppies.

      Worked like a charm.

      Andy

  • Andrew Gutterman June 18, 2013, 2:53 pm

    The charts telegraphed a downside move to ~$1150 long before the April 15 crash. As many may have noticed I’ve been predicting a fall to $1150, the fact that it did half of that over a couple of days doesn’t mean jack. We still have a long ways to go on the downside, and there are no rules that say how long it has to take.

    Andy

  • paul June 18, 2013, 10:52 am

    I just dont know what to make of charts now-a-days. Yes the chart shows the trend but it doesnt explain where the cascade came from on 4/12. What was the reason for the sell off? Ive been more suspicious of the so called “markets”. Call it what you will but when HFT’s can sell millions of oz of gold in milli seconds what difference does a chart make? HFT’s can drive anything down or up in milli seconds and fundamentals and support levels are no longer relevant.

    • Rick Ackerman June 18, 2013, 4:26 pm

      You need to take a trial subscription to Rick’s Picks, Paul, so that you can see for yourself that it’s the HFTs that are irrelevant, not the charts. Technically derived price points still rule — very precisely — even though the algos and the highly trained chimps on the trade desk may be unaware of them.