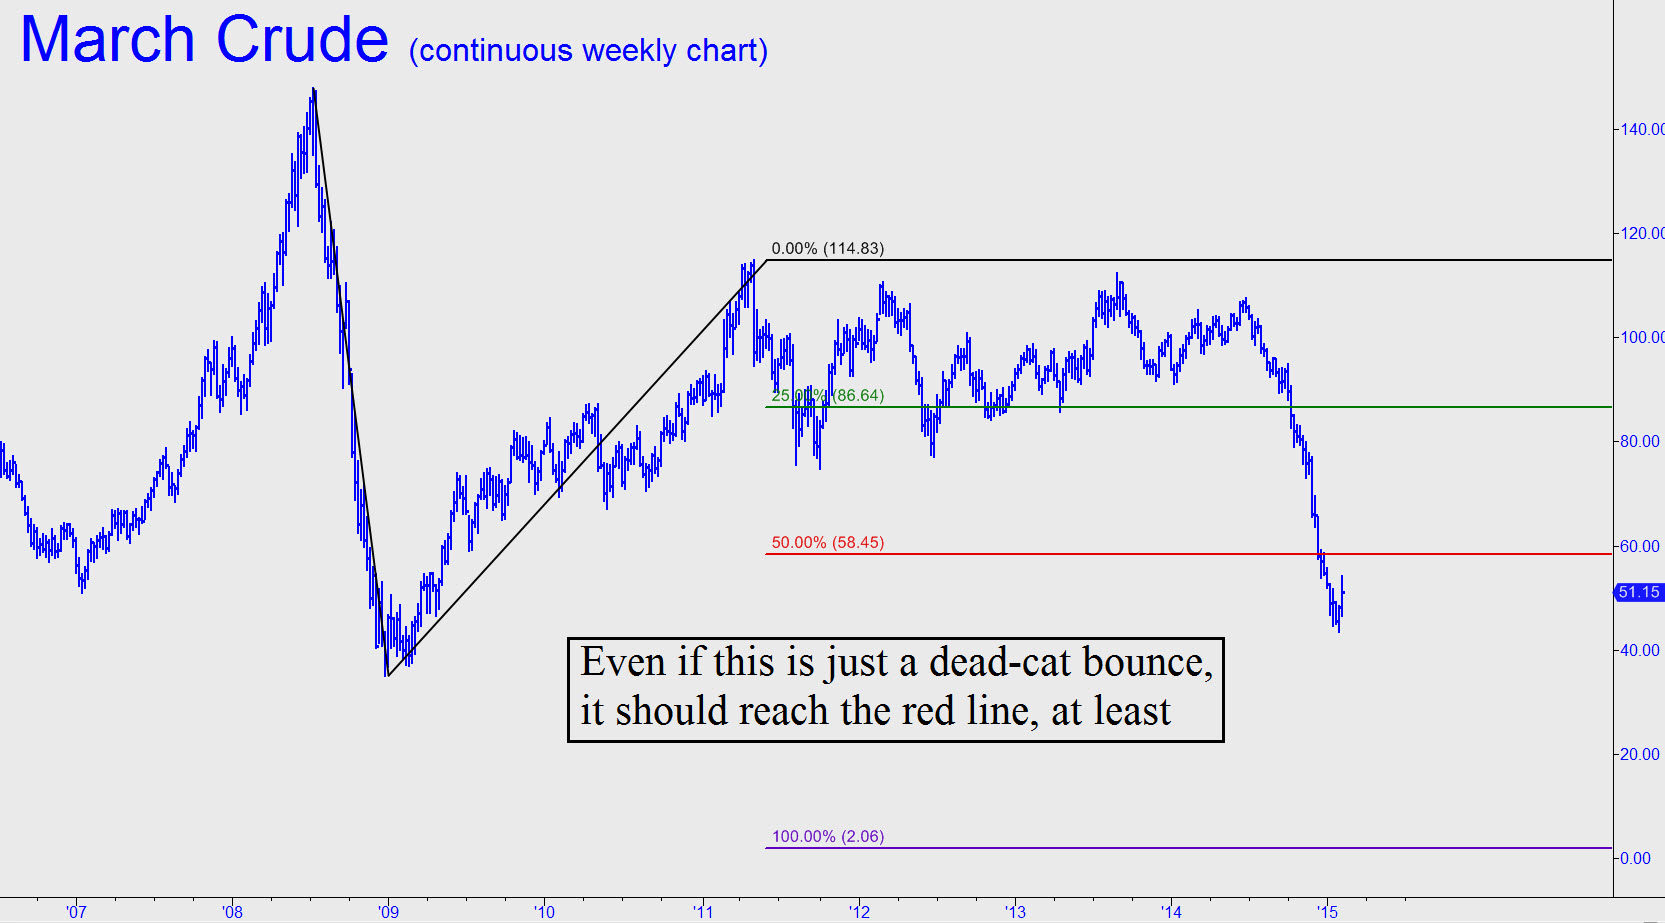
 The futures reversed yesterday from a low that was 26 cents shy of a 47.10 midpoint pivot where we might have expected the turn. The failure to reach a correction target is incipiently bullish, but how high can this suspected dead-cat bounce go? A logical answer is to 58.45. That’s the midpoint Hidden Pivot of the long-term bear-market pattern shown, and a corrective rally that returns to it would hardly be unusual. We often count on it, not only to forecast price swings accurately, but to trade them profitably. Typically, we try to get short at the top of rallies like this one — retracements to midpoint pivots (shown here as a red line). We will in fact attempt to do so aggressively if the opportunity should arise, but in the meantime we’ll trade with a bullish bias, even if we strongly suspect that the rally is no more than reflex bounce that is doomed to fail. A move up to the red line may not look like much in the context of the long-term chart, but it would in fact represent a 34% gain relative to the recent low at 43.58. _______UPDATE (February 26, 10:20 p.m.): Zzzzzzzzz. _______ UPDATE (March 1): I’m tracking the April contract now, and it is as boring as the March. Zzzzzzz.
