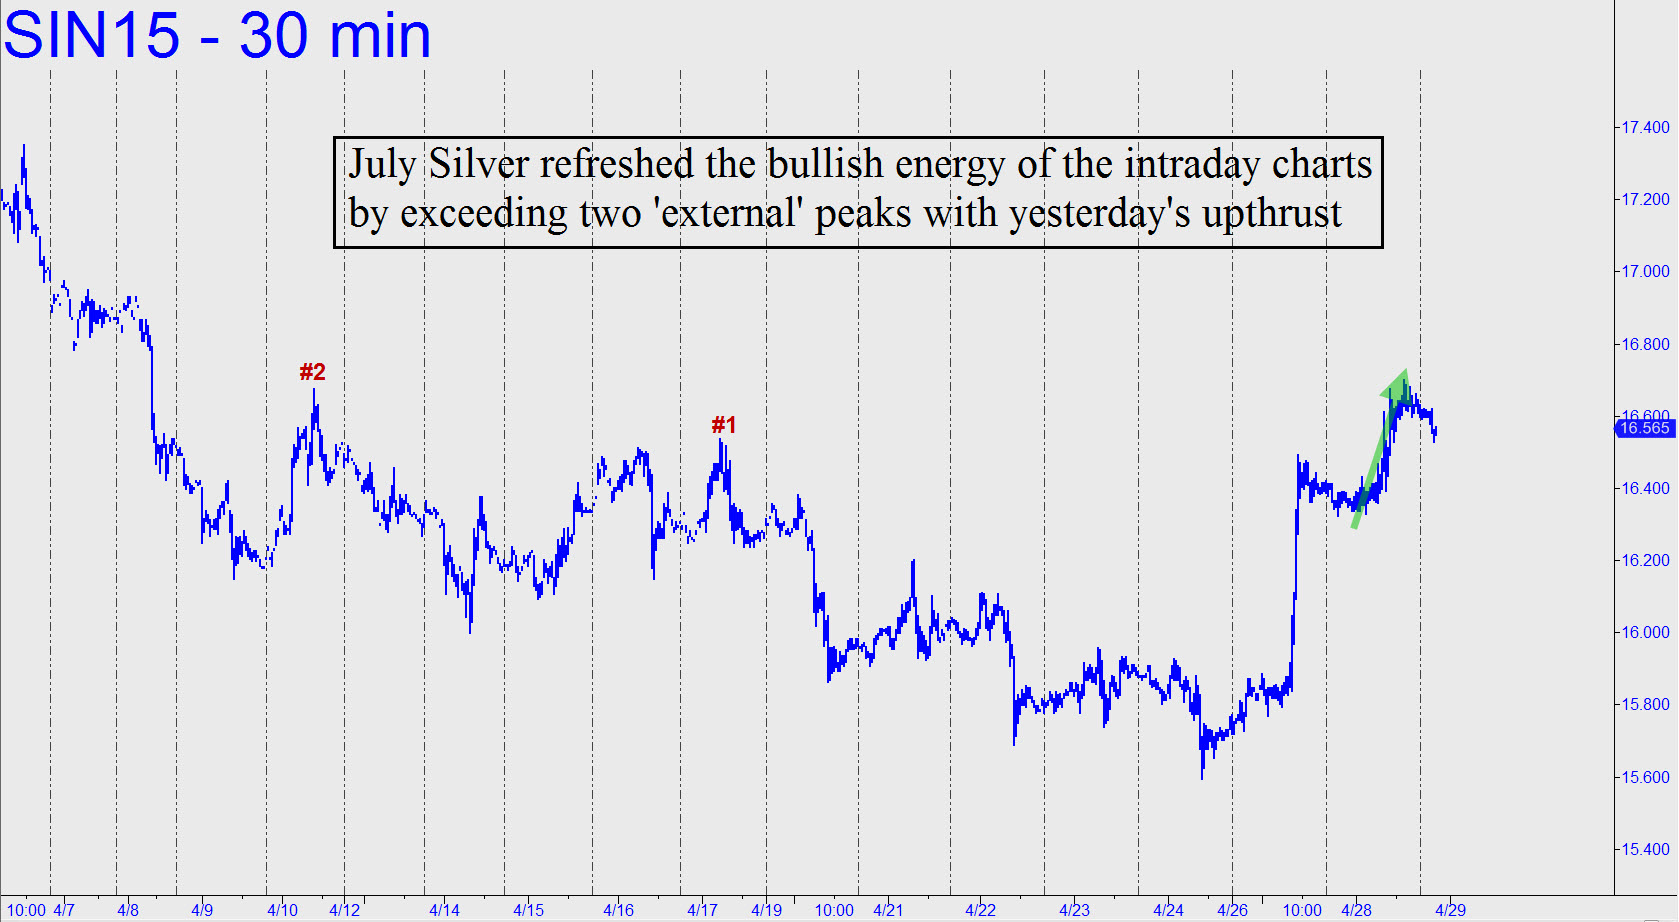
 The downtrending pattern shown is not going to win any beauty prizes, but its precise interplay with the red line, a midpoint pivot that has turned from support into resistance, lends authority to the target itself, 15.185. This is significantly worse that I am expecting in gold, but only time will tell which leads the way. If the weakness continues down to the target, however, that would be bad for both, since it would generate a bearish impulse leg not only on the hourly chart, but on the daily. Considered as a mechanical trade, please note that July Silver was a short last Wednesday from 15.860, stop 16.085. To hint of a turnaround, bulls would need to push above 16.110 within a day or two. _______ UPDATE (9:15 p.m. EDT): A sharp rally has turned the short-term picture quite bullish (see inset, a new chart). We’ll let this week’s further price action tell us whether the buying is for real. _______ UPDATE (April 28, 10:14 p.m.): In robustly bullish fashion, the rally continued, knocking off two ‘external’ peaks in the process (see inset, a new chart). This effectively refreshes the bullish energy of the 30-minute chart, making more upside likely in the days ahead. _______ UPDATE (May 1, 12:15 a.m.): Thursday’s knockdown changed the short-term picture without turning it hopeless. Assuming the corrective rally in progress early Friday morning goes no higher than 16.195, we might expect a tradable bounce from p=15.730 on any next leg down. This midpoint pivot should be adjusted higher if point ‘C’ (16.195) migrates higher overnight. (Note: A=16.730 on the 30-minute chart.) _______ UPDATE (May 3, 10:47 p.m.): A slightly altered pattern yielded a midpoint Hidden Pivot at 15.795. It is moderately bullish that the futures have reversed from above it. Now, a close above 16.365 — or better yet, above p2=16.648 — would indicate short-term upside potential to as high as 16.930. _______ UPDATE (May 6, 11:23 p.m.): For the fourth time in as many days, the futures returned precisely to a 16.365 midpoint pivot after hiccuping higher. The 16.930 rally target with which that pivot is associated is valid and will remain so unless 15.800 is exceeded to the downside. _______ UPDATE (May 7, 11:17 p.m.): The futures cracked the 16.365 support with yesterday’s headless chicken histrionics. If the next feint is lower, look for it to hit 16.118; or if any lower, 15.995. These numbers are the respective p and D Hidden Pivots of a downtrending pattern that on the 15-minute chart began with A=16.650 on 5/6, and thence 16.160 on 5/7. _______ UPDATE (May 10): Zzzzzzzzzzzz.
