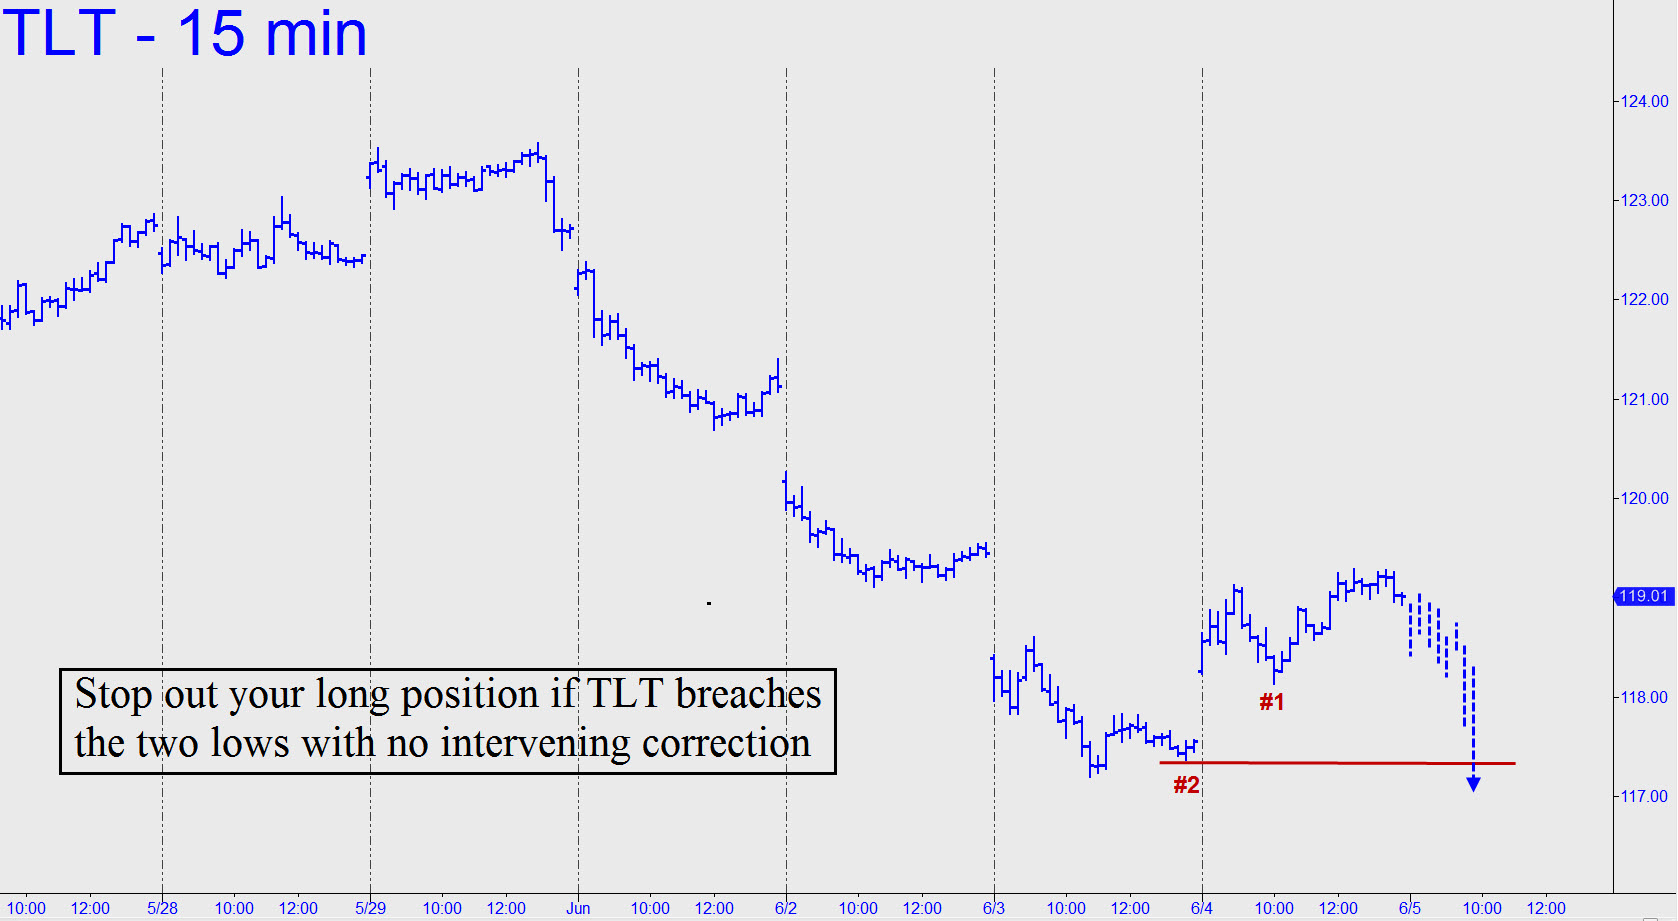
 A 117.23 correction target that we’d been using since April came within three cents of nailing the intraday low of yesterday’s powerful bounce. Several subscribers who used the target reported getting long near the bottom. However, as is my custom, I’ve used the worst price reported, 117.35, to establish a cost basis for an initial position of 400 shares. Because I advised partial profit-taking on half of the position when this vehicle was trading around 119.00, the remaining 200 shares will have an imputed cost basis of 115.70. That will provide an excellent cushion if T-Bonds should relapse. For now, use an ‘impulsive’ stop-loss based on the 15-minute chart. As of this moment (7:52 p.m. EDT), that would imply an uncorrected plunge exceeding 117.37 to the downside. (See inset for a graphic picture.) Against that order, offer 100 shares to close at 120.12. _______ UPDATE (June 7, 4:00 p.m. EDT): Friday’s intraday low missed our stop by a single penny, so we still hold a position. The ostensible cause of the selloff was the usual bunch of trade-desk lemmings reflexively buying into an ostensibly ‘strong’ jobs report. For the dismal, burger-flipping truth about these latest numbers, click here. _______ UPDATE: (June 9, 9:33 a.m.): The position was stopped out at 117.90 on Friday’s opening for a theoretical profit of $440. We’ll back away for now, until this vehicle finds a bottom. _______ UPDATE (7:58 p.m.): Use these Hidden Pivot targets to gauge the strength of the downtrend if TLT continues to stair-step lower: 115.78, 114.77 (or alternatively 114.61); 113.26. As always, the decisive breach of a support would portend a continuation to the next.
