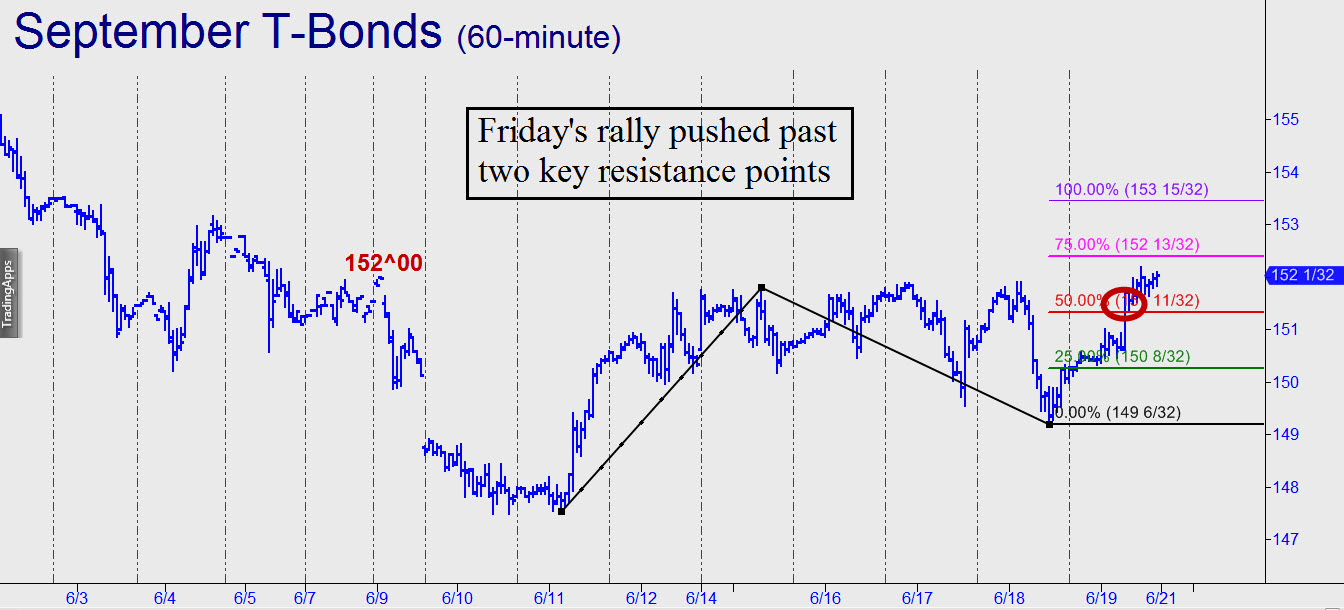
 We’d expected T-Bond prices to enjoy a strong tailwind as long as Greece’s mounting financial problems remain unresolved, and so far that has proven to be the case. The question is, are there additional bullish forces acting on T-bonds that could continue to propel them higher even after the Europe’s spinmeisters announce a supposed remedy? That is the same as asking whether the very nasty correction begun in early April from around 167 is over. It’s still too early to say, although the rally looks promising. Technically speaking, Friday’s upthrust was especially encouraging because it exceeded an external peak at 152^00 recorded on June 9, creating a bullish impulse leg and re-energizing the hourly chart (see inset). Notice as well that the move decisively exceeded the red line, a midpoint resistance at 151^11, implying more upside over the near term to at least p2=152^13, or to 153^15 if any higher. If that last number fails to slow the rally down, it would add to the evidence that the rally is not just a flash-in-the-pan. _______ UPDATE (June 22, 10:18 a.m.): T-Bond futures are getting trashed, surprise surprise. However, so wild have the swings become in this vehicle that the so-far bottom of today’s plunge is merely gratuitous, having exceeded no prior lows of significance on the hourly chart. As such, the nutty price action going back to June 12 still looks like accumulation to me. _______ UPDATE (8:10 p.m.): Sellers continued to hammer away, eventually turning the hourly chart bearishly impulsive before the session ended. This implies the futures could now fall all the way to the June 10 low at 147^16 groping for a bottom. _______ UPDATE (June 24, 6:54 p.m.): A two-day close above 150^16 would earn this vehicle at least a temporary reprieve from the slow death it has been experiencing. _______ UPDATE (June 29, 11:50 p.m.): Yesterday’s upthrust came from a low that fell within five ticks of the 147^16 target flagged above. Powerful as the move was, it nonetheless failed to surpass a key external high at 152^06 recorded on June 19. We won’t presume as to whether a good bottom is in for the painful correction begun in January, but the odds of this would shorten if and when the futures take out 152^06 and possibly one or two more “priors.” It would take nothing less than 155^28, however, to generate a bullish impulse leg on the daily chart.
