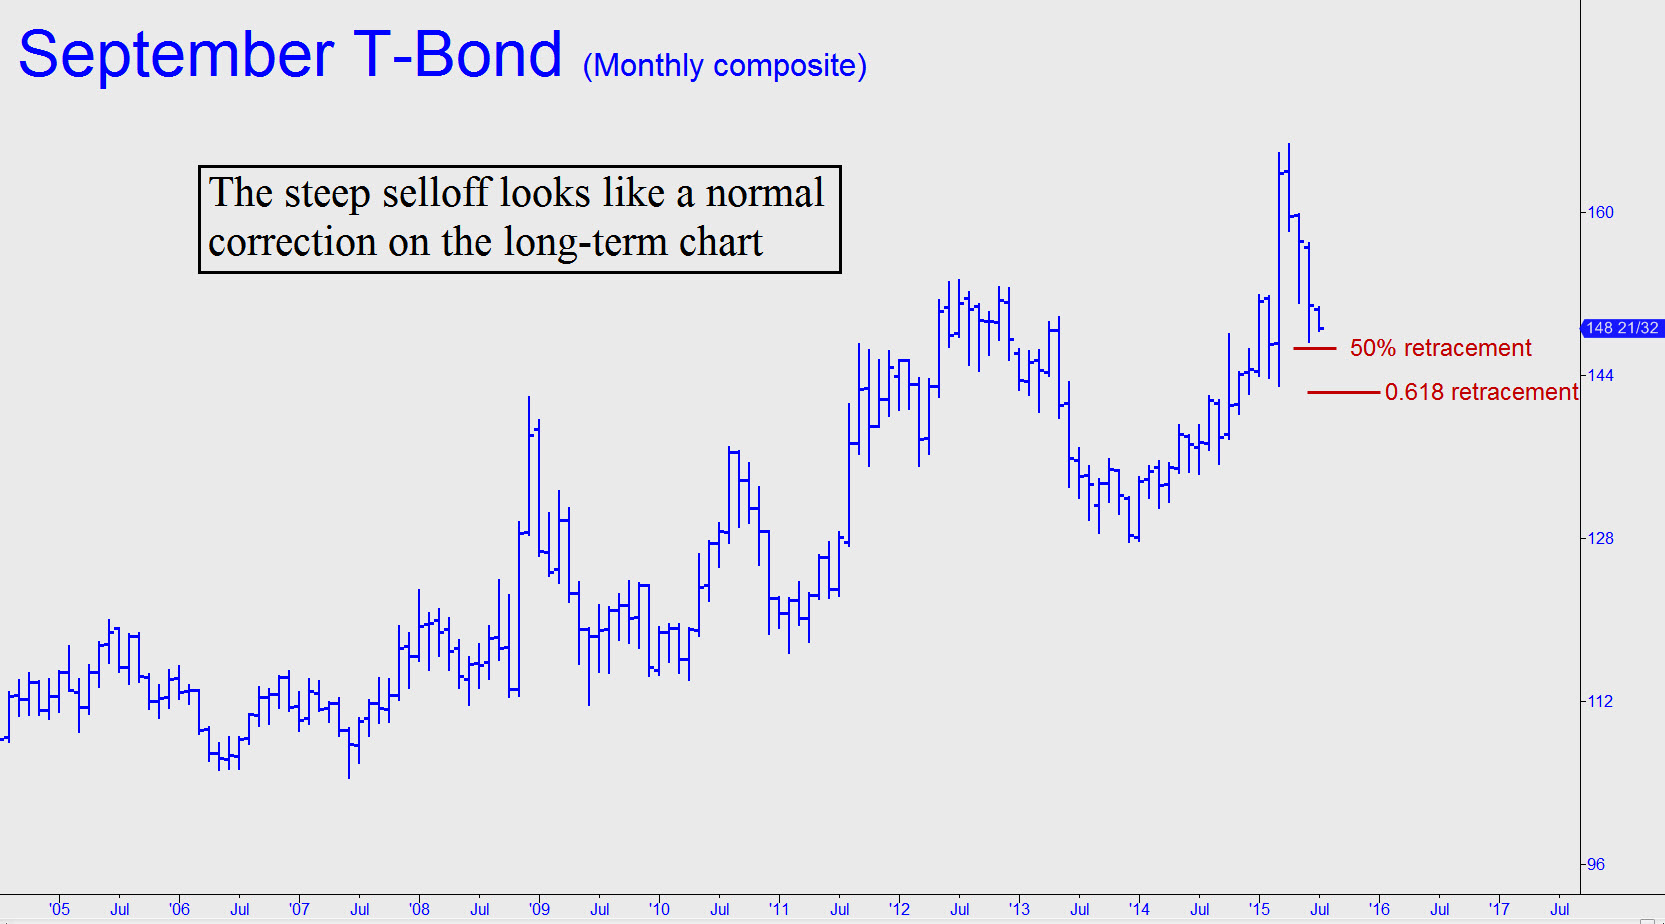
 T-Bonds’ nearly relentless weakness must be viewed in the context of a long-term chart to understand why it is merely corrective rather than impulsive. This means that it is not the beginning of a bear market we have witnessed over the last few months; rather, it is a normal-looking retracement of a very powerful — and still-promising — bull market. For the record, the selloff has yet to retrace even half of the steep climb that took place between December 2013 and March 2015. That would imply more downside to around 147^01, just beneath the recent low. A 0.618 retracement would require a fall to 142^20 — quite a ways from here, although hardly inconceivable. In the meantime, I doubt that the violent short-squeeze rally that accompanied Monday’s news grim news concerning Greece has ended the correction. Accordingly, we might expect more downside to at least 144^25, the p2 Hidden Pivot support of a pattern visible in the daily chart, where A= 157^12 on May 29. _______ UPDATE (July 6, 10:48 p.m. EDT): Yesterday’s explosive rally came within two ticks of a Hidden Pivot target at 152^05 that we identified in real time during an ‘impromptu’ tech analysis session. It would have been more impressive if it had gone just a few ticks higher, surpassing the external peak at 152^06 recorded on June 19. That could still happen today, so we’ll give bulls the benefit of the doubt for the time being. _______ UPDATE (July 8, 11:46 p.m.): Bulls have pushed higher, setting up a test of a key peak at 155^27 recorded on May 29. If they can surpass it by week’s end, that would fortify the rally so far by refreshing the bullish impulsiveness of the daily chart._______ UPDATE (July 13, 12:47 a.m.): The huge swings are getting mighty tiresome, but my gut feeling is that T-Bond futures are carving out a bottom.
