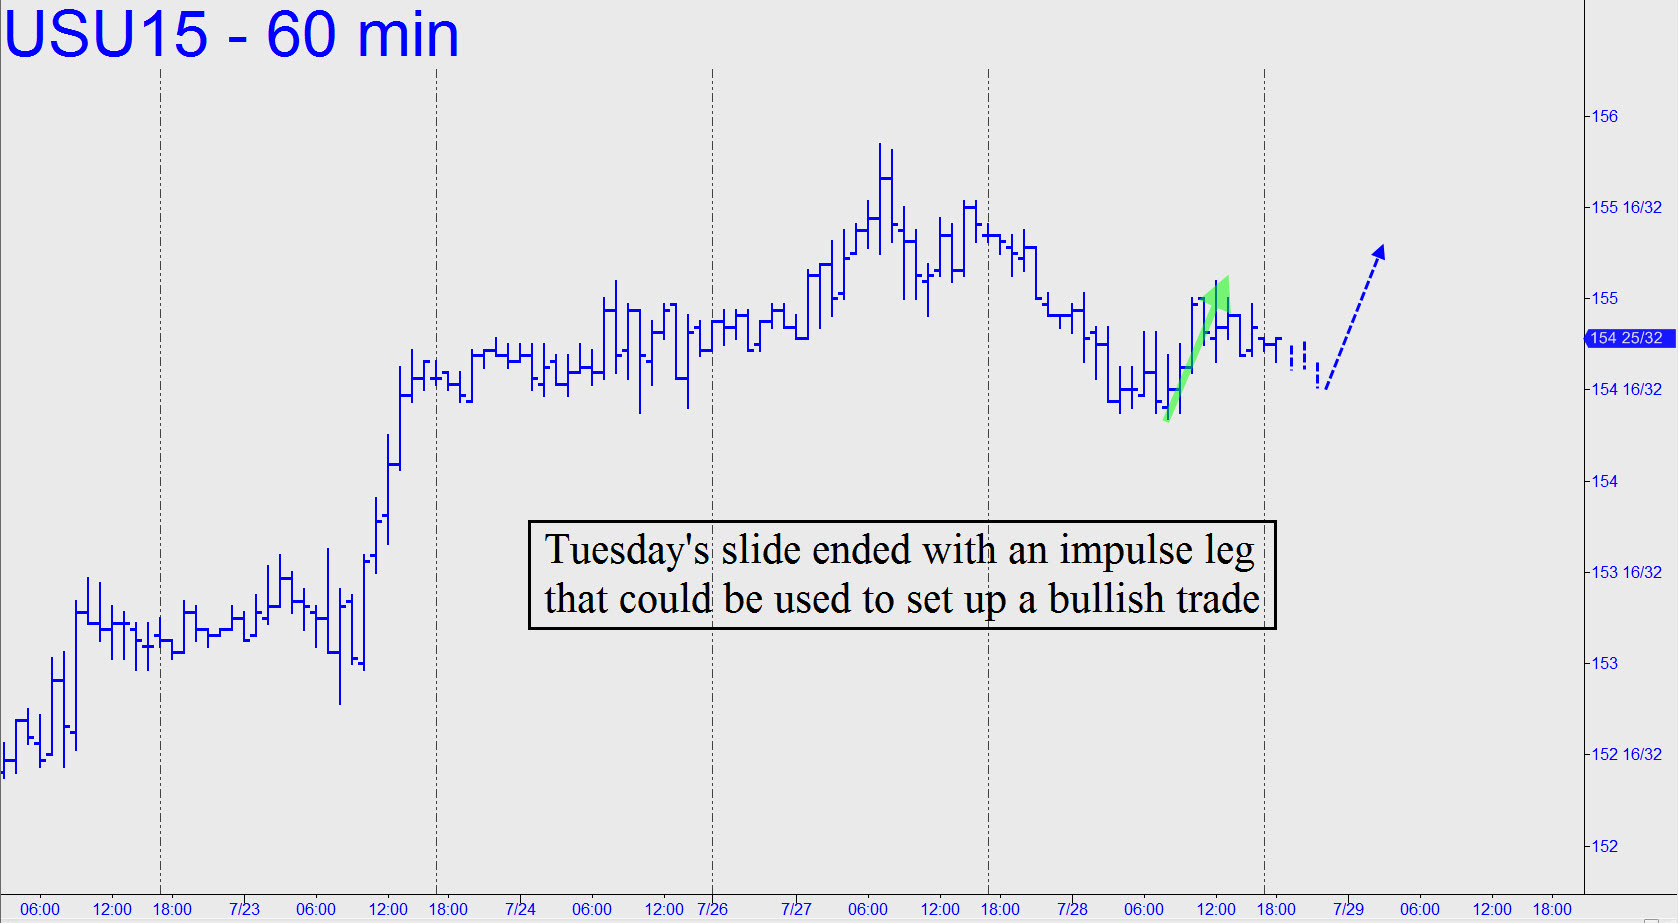
 The steep rally begun last Thursday from 152^25 is encouraging for two reasons: 1) it has exceeded the D target of any rally I could have projected using the 60-minute chart; and 2) Monday’s thrust looked sufficiently powerful to continue past a key resistance at 155^27 recorded on 5/29. Yesterday’s rally tied that peak, but I’d be surprised it if doesn’t get past it over the next day or two. If and when that occurs, it would strongly suggest that the futures are about to break out of an apparent consolidation that has been going on since early May. If so, it could present a low-risk entry opportunity via camouflage. Although breakouts are high-stress events for most traders, they are just garden-variety simply impulse legs and ABC patterns for us. Thus, any pullback from just above 155^27 could be used as the B-C leg of a tradable ABCD pattern on the 15-minute chart. Traders, take note. ______ UPDATE (July 28, 7:58 p.m.): Tuesday’s corrective slide ended with a bullish impulse leg on the hourly chart (see inset). I’ve sketched a hypothetical entry set-up that night owls can use to get aboard for the next push. Theoretical entry risk would be about $190 per contract, but you could cut that down to size by using a ‘camouflage’ trigger on a chart of lesser degree. ______ UPDATE (July 29, 8:35 p.m.): We’ll back away for now, since the rally never got off the launcher. Although the futures look close to a bullish reversal on the hourly chart, you’ll need to supply your own entry plan because the relevant Hidden Pivot supports are numerous and potentially labor-intensive.
