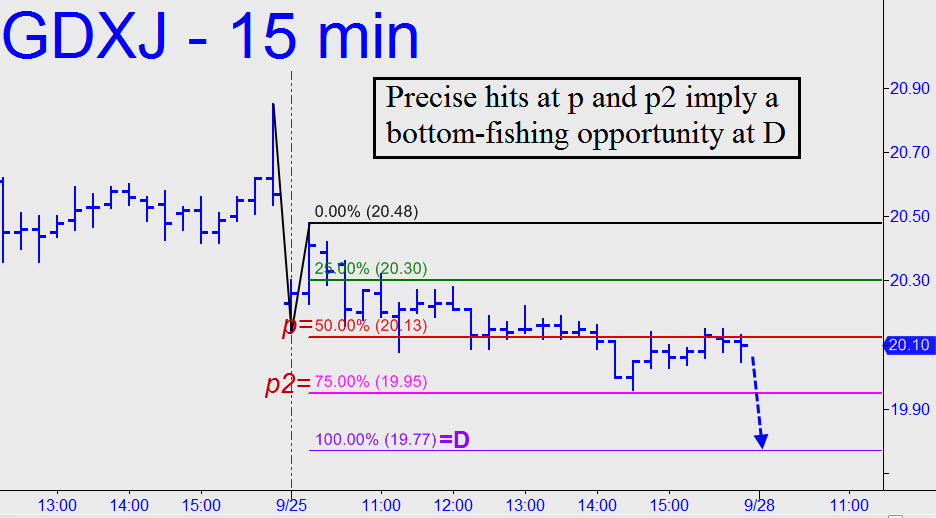
 GDXJ has tangoed pretty tightly with the p and p2 pivots of the pattern shown, implying that traders would get good odds bottom-fishing at or very near the pattern’s 19.77 ‘d’ target. I have lower-cased the ‘d’ in this instance because the retracement lies within a larger bullish pattern projecting to as high as 22.78 in the days ahead (60-minute, A=19.39 on 9/11). That target will remain viable as long as 19.50 is not exceeded to the downside first, and odds of its being reached would shorten considerably following a close above 21.14. _______ UPDATE (10:51 p.m.): The reversal off Friday’s bull-trap peak is more than a little disappointing, since it came after GDXJ failed to reach a relatively ‘easy’ midpoint Hidden Pivot resistance at 21.14. The selloff has created a new point ‘C’ low for our bullish pattern, but another day of slippage could negate it, turning the hourly chart bearish. If GDXJ instead rallies, it wouldn’t be the first time this vehicle has sauntered to the edge of an abyss, only to recover moderately when prospects looked grim. _______ UPDATE (September 30, 1:04 a.m.): GDXJ would have to hit 19.94 today to register a pulse, and then get past p2=20.76 to suggest there’s some life stirring beneath the surface. To locate those levels on the hourly chart, use A=18.39 on 9/11. _______ UPDATE (October 5, 10:26 p.m.): With yesterday’s thrust, GDXJ has done everything we’d asked of it. In the process, it has become a ‘mechanical’ buy on a pullback to p=20.65, stop 20.11. Once long, you’ll be shooting for 22.27. The pattern can be found on the 30-minute chart, where A=18.39 on 9/11. _______ UPDATE (October 6, 9:36 p.m.): GDXJ took off overnight after having gone no lower than 20.75, so officially we hold no position.
