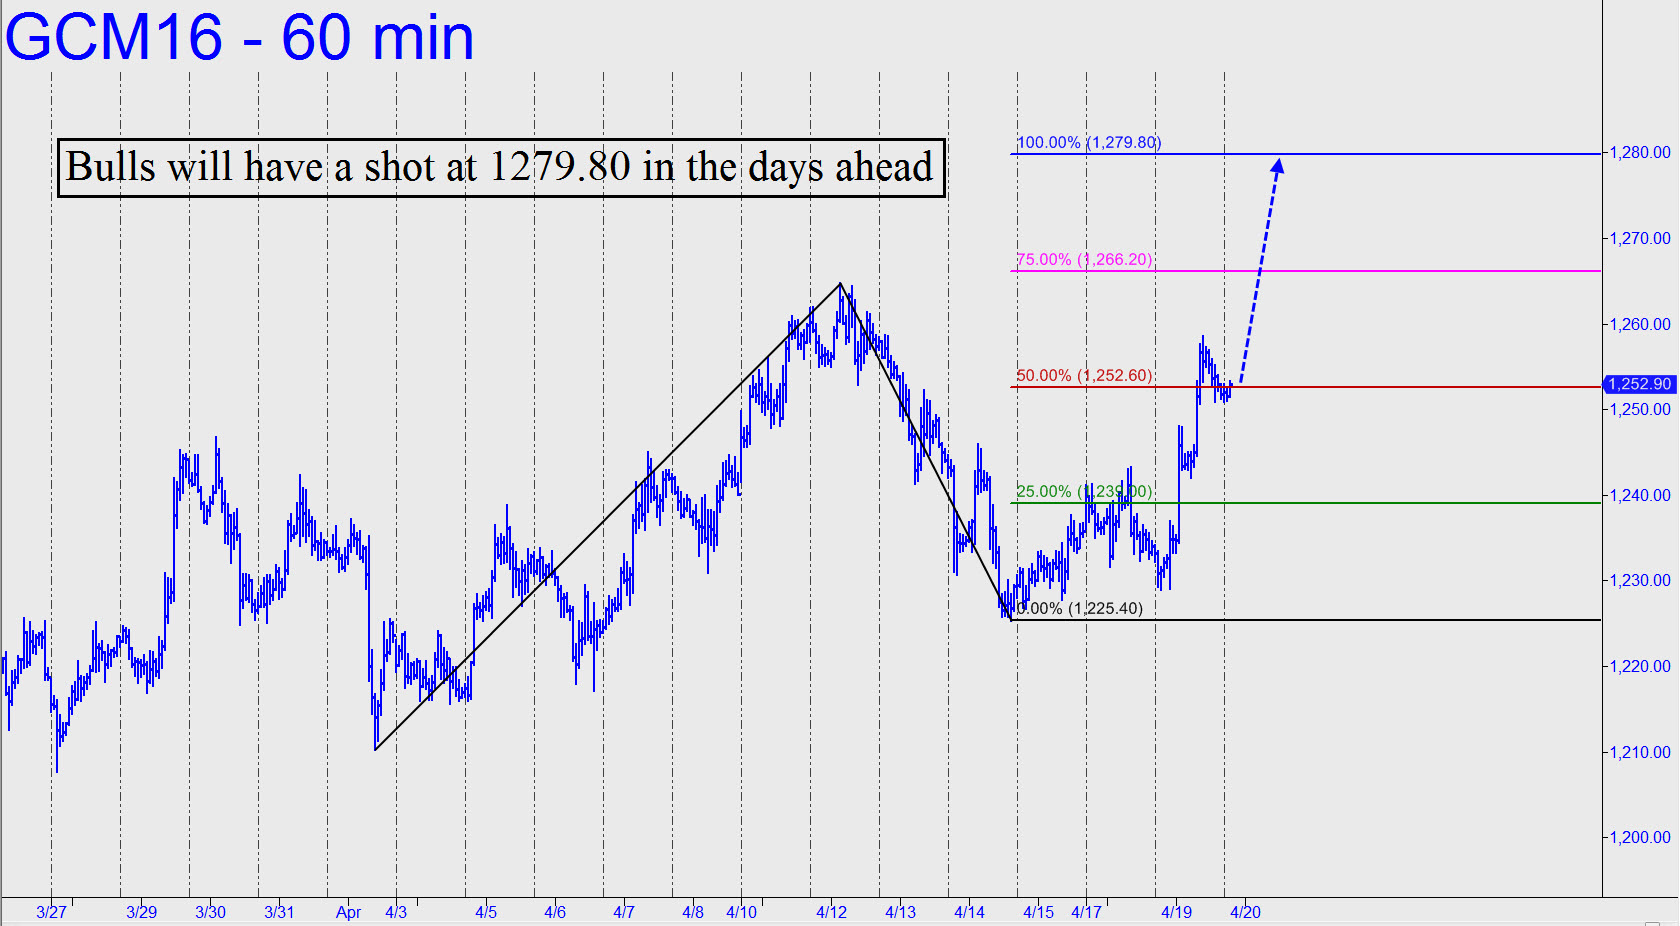
 June Gold fell back into what may have seemed like a rut at week’s end, but the important thing to notice is that the high recorded on Tuesday slightly exceeded an external peak at 1262.20 notched three weeks earlier. That means any pullback to as low as 1210.40 (see inset) will still leave a bullish impulse leg on the daily chart. Moreover, it could provide a ‘counterintuitive’ opportunity to get long with relatively little risk. Accordingly, I’ll recommend using an ABC pattern similar to the one I’ve sketched hypothetically to get long. The closer the point ‘C’ low is to ‘A’ without tying it, the more appealing the trade will be. _______ UPDATE (April 19, 8:18 a.m. ET): The futures are bound for the 1252.60 midpoint pivot of this pattern on the hourly chart: A=1210.30 (4/1); B=1261.40 (4/12). The D target, if bulls go for the gusto, is 1279.80. The in-between target, if the futures exceed 1252.60, is p2=1266.20. _______ UPDATE (April 19, 8:16 p.m. ET): The futures closed above 1252.60, raising the odds of further progress over the near term toward the 1279.80 target given above. ‘Camo’ traders can use either of two external peaks on the hourly chart to get long with reduced risk. The first lies at 1258.70 (4/12 at 9:00 p.m.); the second, just above it, at 1261.30. Note: The futures are already a ‘mechanical’ buy on the pullback to p=1252.60, stop 1243.50, but the implied initial risk of $900 may be too rich for some of you traders, and that’s why I’ve recommended ‘camouflage’ as an option.
