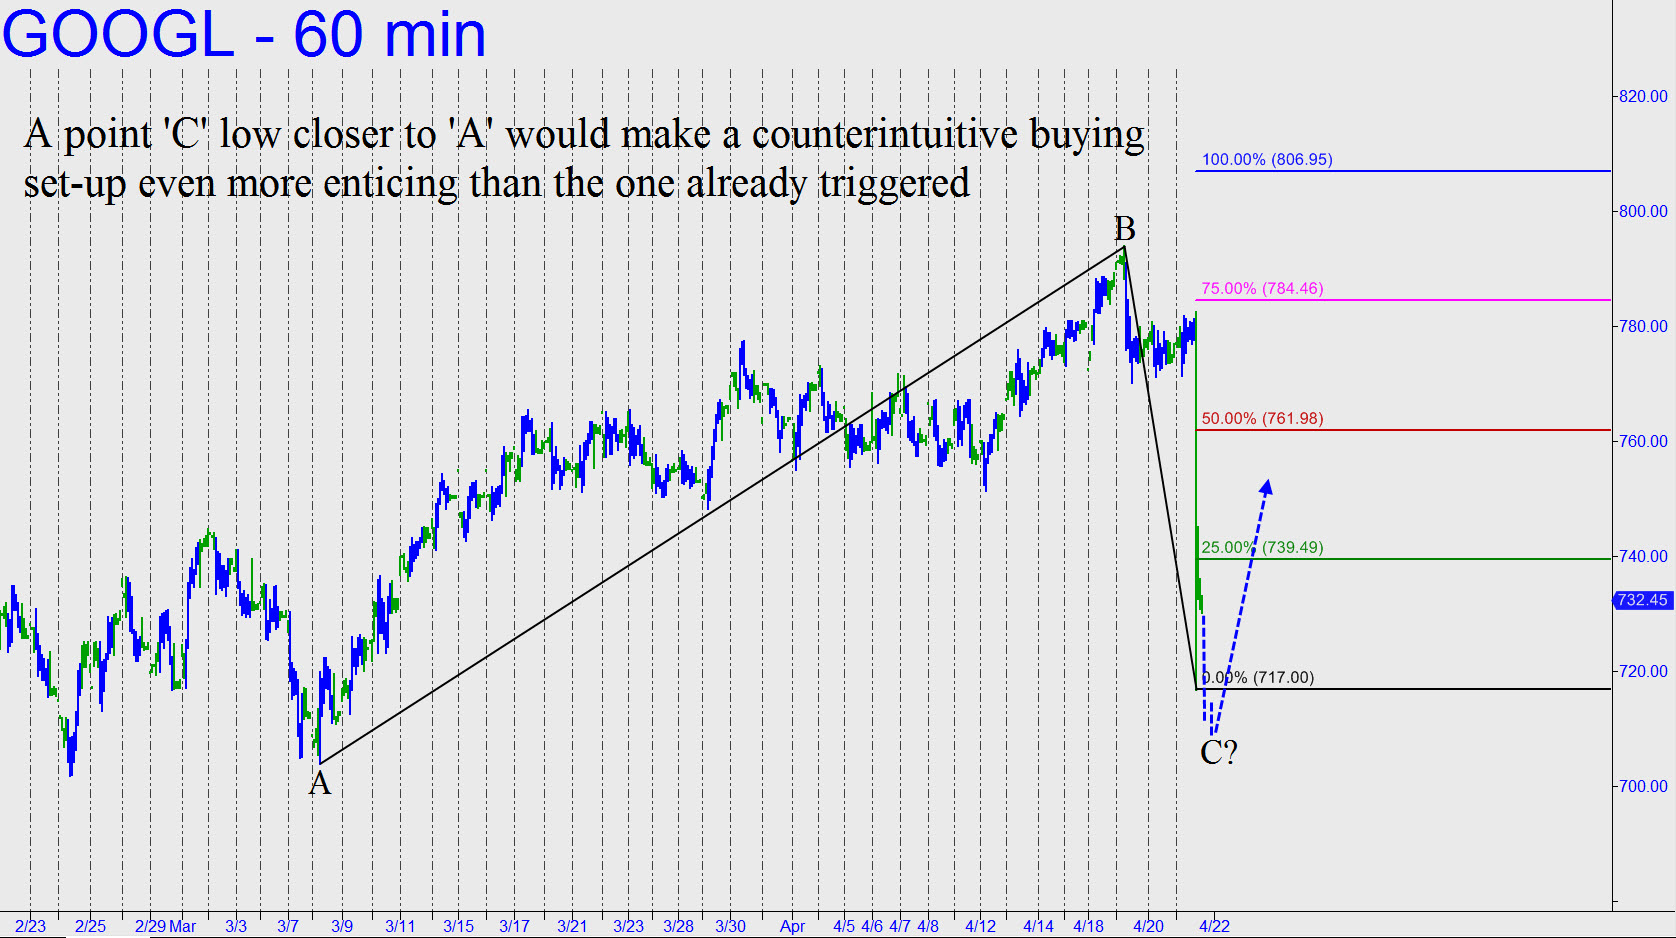
 Monday’s push past a major Hidden Pivot midpoint resistance at 778.27 (see inset) hints that GOOGL is developing thrust ahead of Thursday’s earnings announcement after the close. The stock has yet to move decisively above the resistance, but just a little more lift on Tuesday would do it. Immediate potential is to 826.39, a secondary pivot that lies 6% above Monday’s settlement price. If earnings are good enough to surprise and the stock blows through 826.39, it would be implying yet more upside to as high as 874.52, the ‘D’ target of the pattern shown. There may be a relatively low-risk opportunity to get onboard if price action turns wild, so stay close to the chat room for guidance in real time. _______ UPDATE (April 19, 7:52 p.m. ET): The stock fell hard on Tuesday along with a weak tech sector, but that doesn’t necessarily mean earnings due out after Thursday’s close will be weak. The bullish pattern shown in the chart remains viable in any case, even if price action so far has not signaled us to get long ‘mechanically’ at the midpoint pivot. ________ UPDATE (April 22, 1:35 a.m.): A 17% increase in revenues to $20.26 billion supposedly disappointed analysts, sending GOOGL shares plummeting 8.2% in after-hours trading to a so-far low of 717.00. The analysts work for the very same firms whose trade desks at this moment are probably buying the brazen shakedown hand-over-fist from widows and pensioners caught in the long squeeze. Relative to the 717.00 low, the stock became a ‘counterintuitive’ buy at 739.49 on the initial bounce. The fire-sale opportunity would look even more enticing if a relapse creates a print closer to 704.00. This number corresponds to a low recorded on March 8 that I’m using as a point ‘A’ for the pattern shown. _______ UPDATE (May 1): Last week’s steep slide has exceeded 704.00, negating the prospect of a ‘counterintuitive’ trade using that number.
