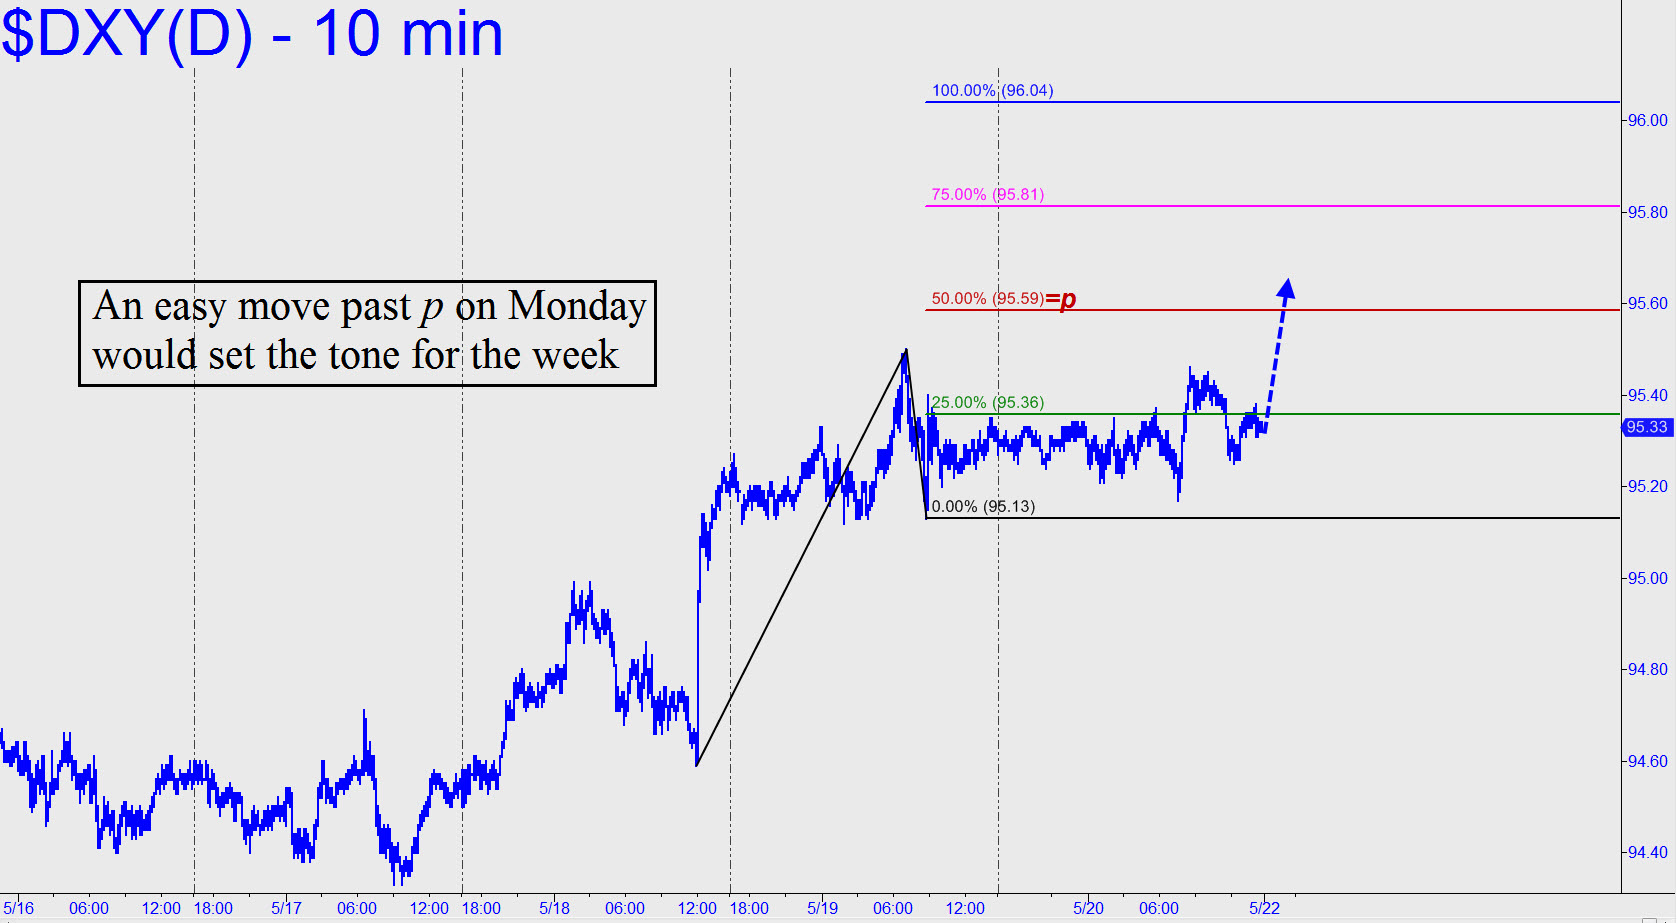
 Bingo! Friday’s powerful rally exceeded by nine cents the 94.76 Hidden Pivot target we’d been using to keep us confidently and securely on the right side of the trend. DXY popped to an intraday high at 94.85, slightly overshooting our price objective. This implies that the rally is likely to continue in the days, or perhaps even weeks, ahead. The move would need to hit 96.41 to turn the daily chart impulsively bullish. The last time that happened was in November, but it proved to be a false start. We’ll be better able to judge the staying power of the rally by observing minor corrections closely. If the larger picture is to remain bullish, we should see downtrending abc patterns on the lesser charts fail to reach their ‘d’ targets. _______ UPDATE (May 22, 12:59 p.m. EDT): Use the pattern shown (inset, a new chart): to gauge the dollar’s strength, or lack of it, in the days ahead. A move Monday or Tuesday past the midpoint Hidden Pivot at 95.59 (the red line) would affirm the bullish case for the near term and set DXY on course for a run-up to at least 96.09. As always, a decisive breach of any Hidden Pivot level would portend more upside to the next.
