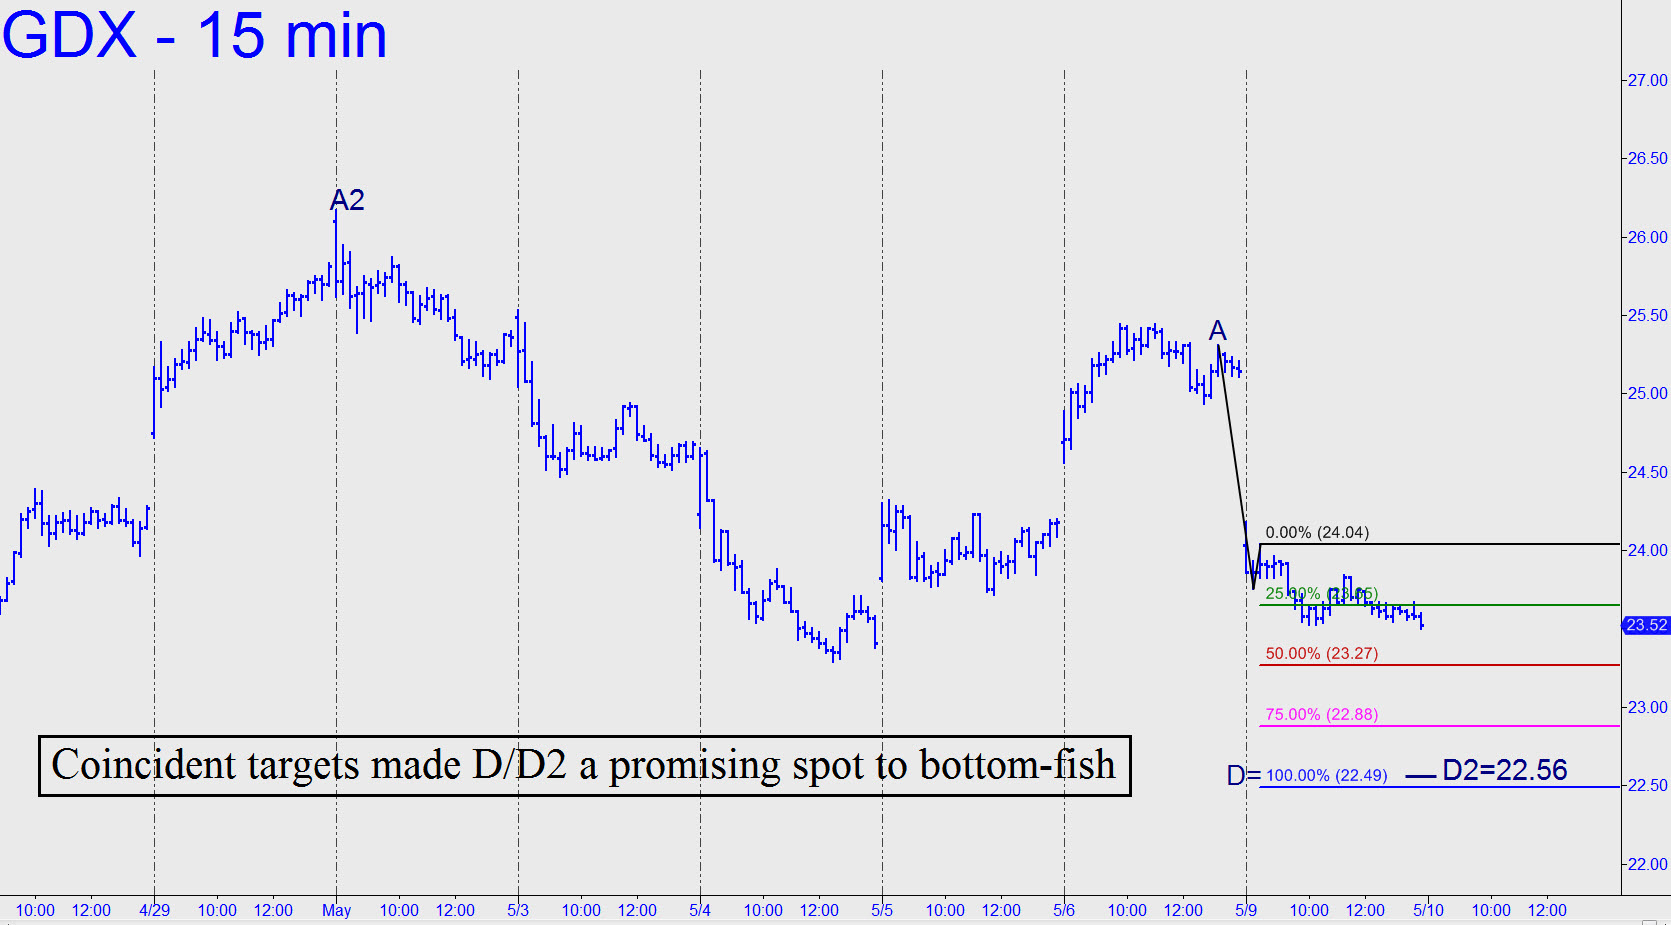
 A new voice in the Rick’s Picks chat room predicted on Wednesday that GDX is going to retrace half of this year’s substantial gains. The basis of this grim forecast is the ‘three black crows’ candlestick formation that I’ve circled on the chart (see inset). The pattern of three long, down bars, each closing beneath the previous day’s bar, is indeed ominous. This particular picture is not quite textbook, however, since the high of each successive candlestick is supposed to extend into the red body of the one above it. If anything, however, this deviation makes the selloff look steeper and even more menacing than the classic pattern. If this gold-miners proxy is in fact about to fall by 50%, that would bring it down from a current 23.41 to around 19.28. Although I see nothing so bearish in Comex Gold futures, there is reason for caution. Check out my latest tout for the June contract to see why. _______ UPDATE (May 8, 7:32 p.m. ET): Bulls reversed the momentum of the ‘three crows’ last week, but they’ll need to push above a 25.19 midpoint Hidden Pivot where they stalled on Friday to take command. That resistance is tied to a 27.09 target that can be found on the daily chart where A= 22.37 on 4/25. ______ UPDATE (May 9, 10:45 p.m.): Bulls got sacked on the opening and never recovered. Now, use the pattern shown to gauge sellers’ strength. If they push GDX decisively below the red line (p), look for more slippage to at least 22.49, That’s just seven cents from the 22.56 target of the larger pattern, so there is almost certain to be good support down there. Accordingly, you can bottom-fish with a stop-loss as tight as 22.42._______ UPDATE (May 10, 11:03 p.m.): GDX opened lower but managed to avoid trouble with a strong, $1.16 bounce off the lows. The rally would become technically significant if and when it exceeds a small peak at 25.53 recorded last Tuesday. ________ UPDATE (May 13, 3:16 a.m.): Close but no cigar. Let’s give it another day to do the right thing. _______ UPDATE (May 18, 10:59 p.m.): GDX in fact did the wrong thing, shedding 8% of its value in a single day. Surprisingly, the plunge did little technical damage to the hourly chart. That would change if the sell-off continues and GDX drops below 23.29, but we’ll wait for it to happen before we start to worry. _______ UPDATE (May 19, 10:03 p.m.): Correction: We can start to worry if and when GDX falls beneath April 25’s 22.37 low. _______ UPDATE (May 24, 5:42 p.m.): Another inch lower and GDX will generate a bearish impulse leg on the daily chart, something it hasn’t done in more than four months.
