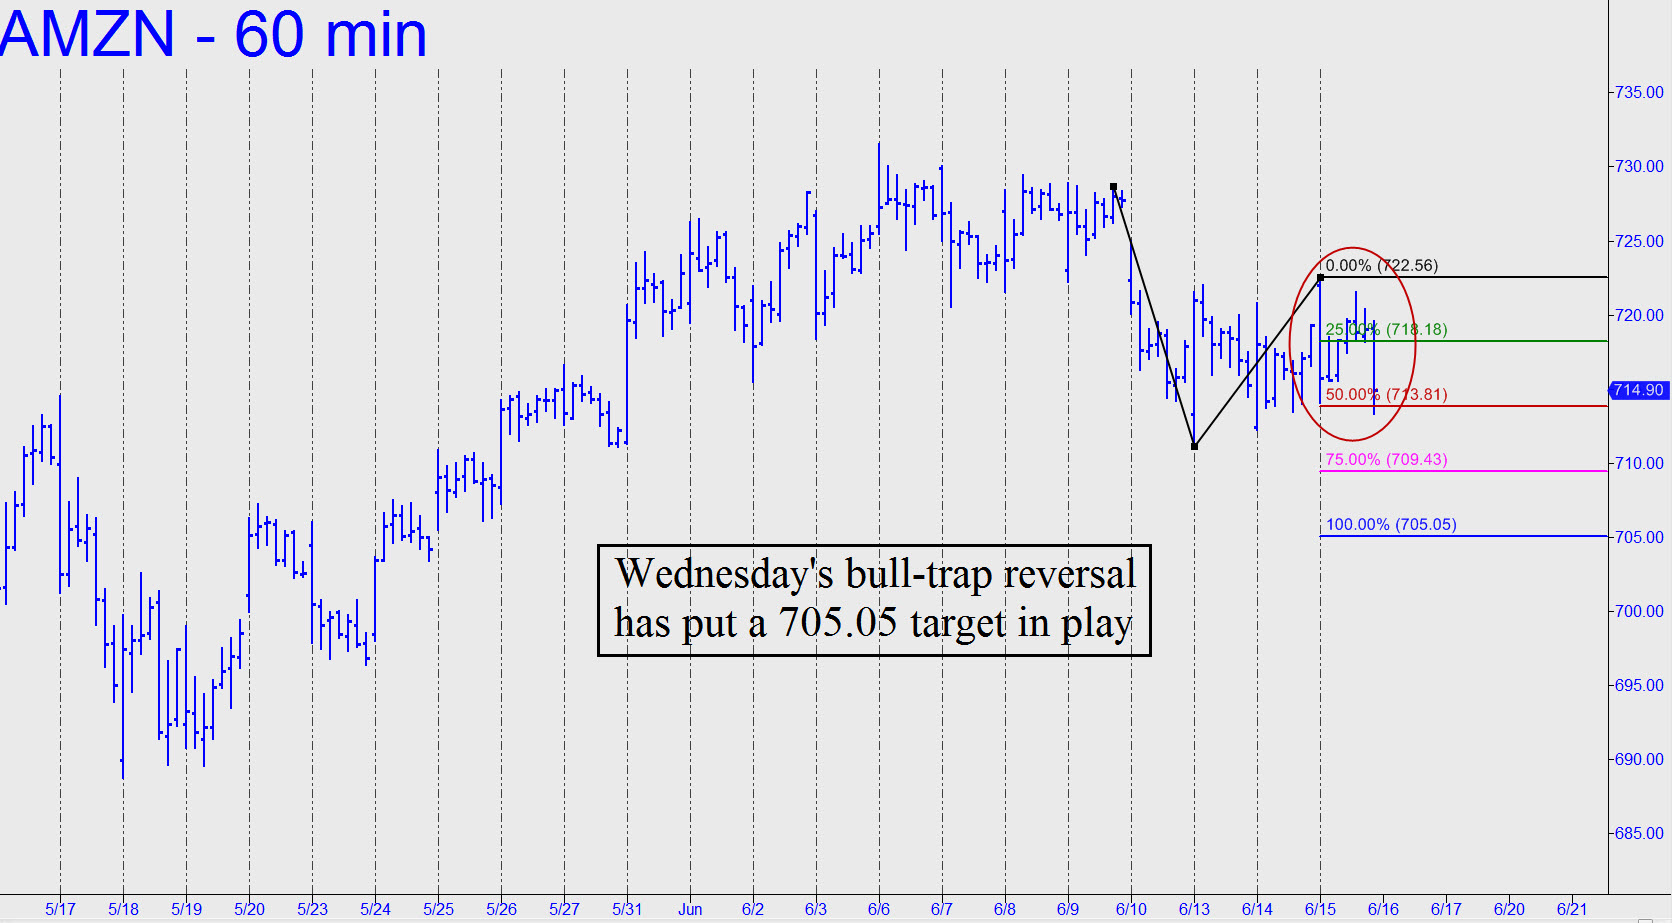
 AMZN can serve to corroborate or negate any signs of weakness that surface in the broad averages, since there’s no way this bellwether stock and the stock market as a whole will go their separate ways for long. The chart shown is mildly troubling, if not yet distressed, because of the failure of buyers to push AMZN to the 742.35 target after nearly six weeks of trying. Moreover, a ‘mechanical’ buy at the pink line, a ‘secondary’ Hidden Pivot, would have been stopped out on Monday’s opening bar. The resulting abc downtrend projects to 713.24 at a minimum. That is the midpoint Hidden Pivot support, on the 15-minute chart, of a=728.67 (6/9); b=711.16 (6/13), and if it breaks easily, we should brace for more downside over the very near-term to at least p2=708.86, or d=704.48. An easy breach of that last number would be the equivalent of yellow warning flags out around the track. _______ UPDATE (June 14, 7:02 p.m. EDT): The downtrend slightly overshot the 713.24 pivot on the opening bar, but on an inside day, the gratuitous spasms that followed changed nothing in my analysis. ________ UPDATE (June 15, 8:59 p.m.): Today’s bull-trap reversal has put a 705.05 downside target in play (see inset, a new chart), since the midpoint Hidden Pivot support with which it is associated was breached slightly. _______ UPDATE (June 16, 11:28 p.m.): The stock rallied $13 from with 25 cents of the 705.05 correction target. Since no one mentioned this in the chat room, however, I have not established a tracking position.
