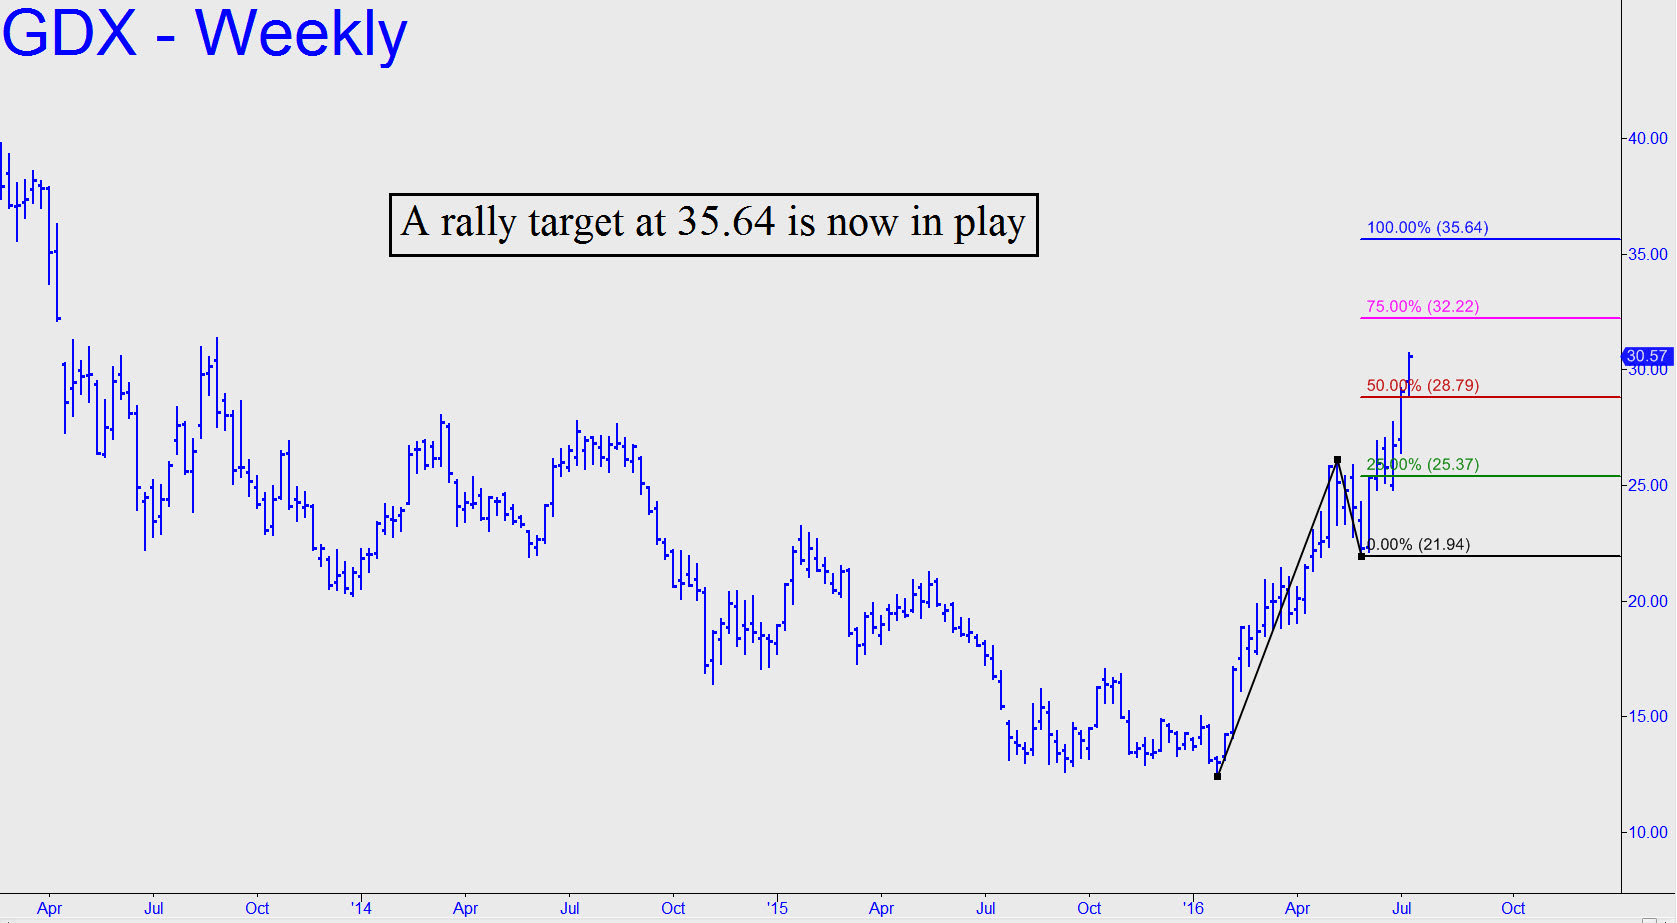
 The 28.79 target we used to stay on the right side of the move, and to be unhesitatingly bullish for the ride, has been decisively exceeded. Ordinarily this would imply that significant buying power remains, but let’s first see how buyers handle the 29.70 target, a Hidden Pivot resistance derived from the second half of the rally pattern used to project 28.79. If they push easily past it, there will be no picture-perfect rally patterns remaining to be culled from the daily chart. One thing would be clear nevertheless: GDX is going even higher, perhaps significantly so, in the days and weeks ahead. _______ UPDATE (9:34 p.m.): So far, so good. Buyers gapped this vehicle higher on the opening bar, pushing the stock decisively above 29.70 to a 30.68 intraday high. If the rally continues, taking out a key peak at 31.35 recorded nearly three years ago, bulls will have the bad guys on the run — and a shot at 35.64. That target can be found on the weekly chart (see inset), the summit of a somewhat unconventional pattern. _______ UPDATE (July 21, 6:58 p.m.): For now, use these coordinates on the 60-minute chart to gauge the strength of this correction: a=30.05 (7/18); b=27.80; c=?. This pattern would be validated by a print down at x=28.46, but once that occurs the midpoint pivot (p) would become a logical minimum downside target. _______ UPDATE (July 25, 7:51 p.m.): GDX looks like a 90% shot to fall to at least 26.77 before this two-week-old correction has run its course. Here’s the relevant pattern on the 60-minute chart: a=30.05 (7/18); b= 27.80 (7/20); c=29.02.
