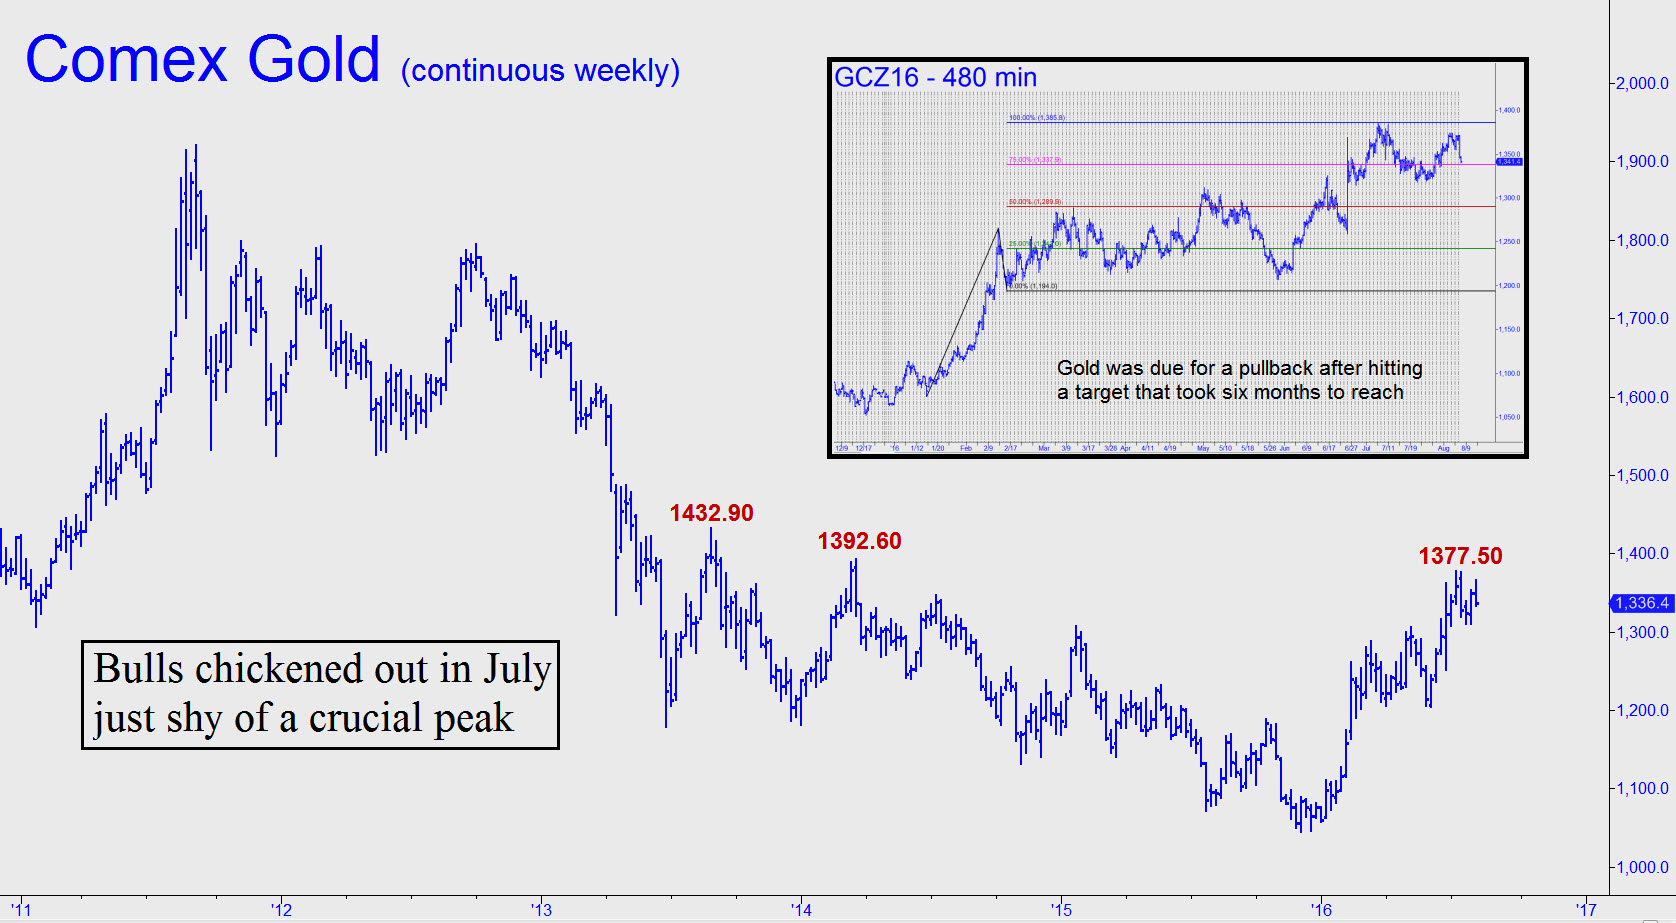
 Gold futures have made no headway since early July, when the December contract came within a hair of a 1385.80 target that had taken six months to reach (see chart-in-chart inset). The correction has been relatively shallow so far, and that’s encouraging. However, the bigger picture shows that this latest phase of the 2016 bull just missed ‘impulsing’ past an imposing peak at 1392.60 recorded in March 2014. Such timidity should temper our expectations at the moment for an explosive breakout. More likely in my estimation would be some backing and filling of the 172-point gain achieved since early June. I’m not ruling out a big move over the next few weeks, and it would have powerfully bullish implications if it were to exceed the 1432.90 peak (an approximation, since this is a continuous chart) achieved in August 2013 without a significant pullback on the weekly chart. Most immediately, Friday’s slide left me with no strong bias, only a mild interest in this set-up taking shape on the hourly chart for a possible ‘counterintuitive’ buy Sunday night or Monday: A=1336.70 (7/29 at 5:00 a.m., EDT): B=1374.20; and C=?. _______ UPDATE (August 8, 6:44 p.m. EDT): Monday’s slight weakness negated the trade I’d suggested, but here’s another pattern from the hourly chart that could evolve overnight into a ‘counterintuitive’ buying opportunity: A=1328.30 (7/27); B=1374.20 (8/2); and C=won’t exist until a buy signal is tripped via an 11.50 point rally from a low occurring between 1329.00 and 1331.00.
