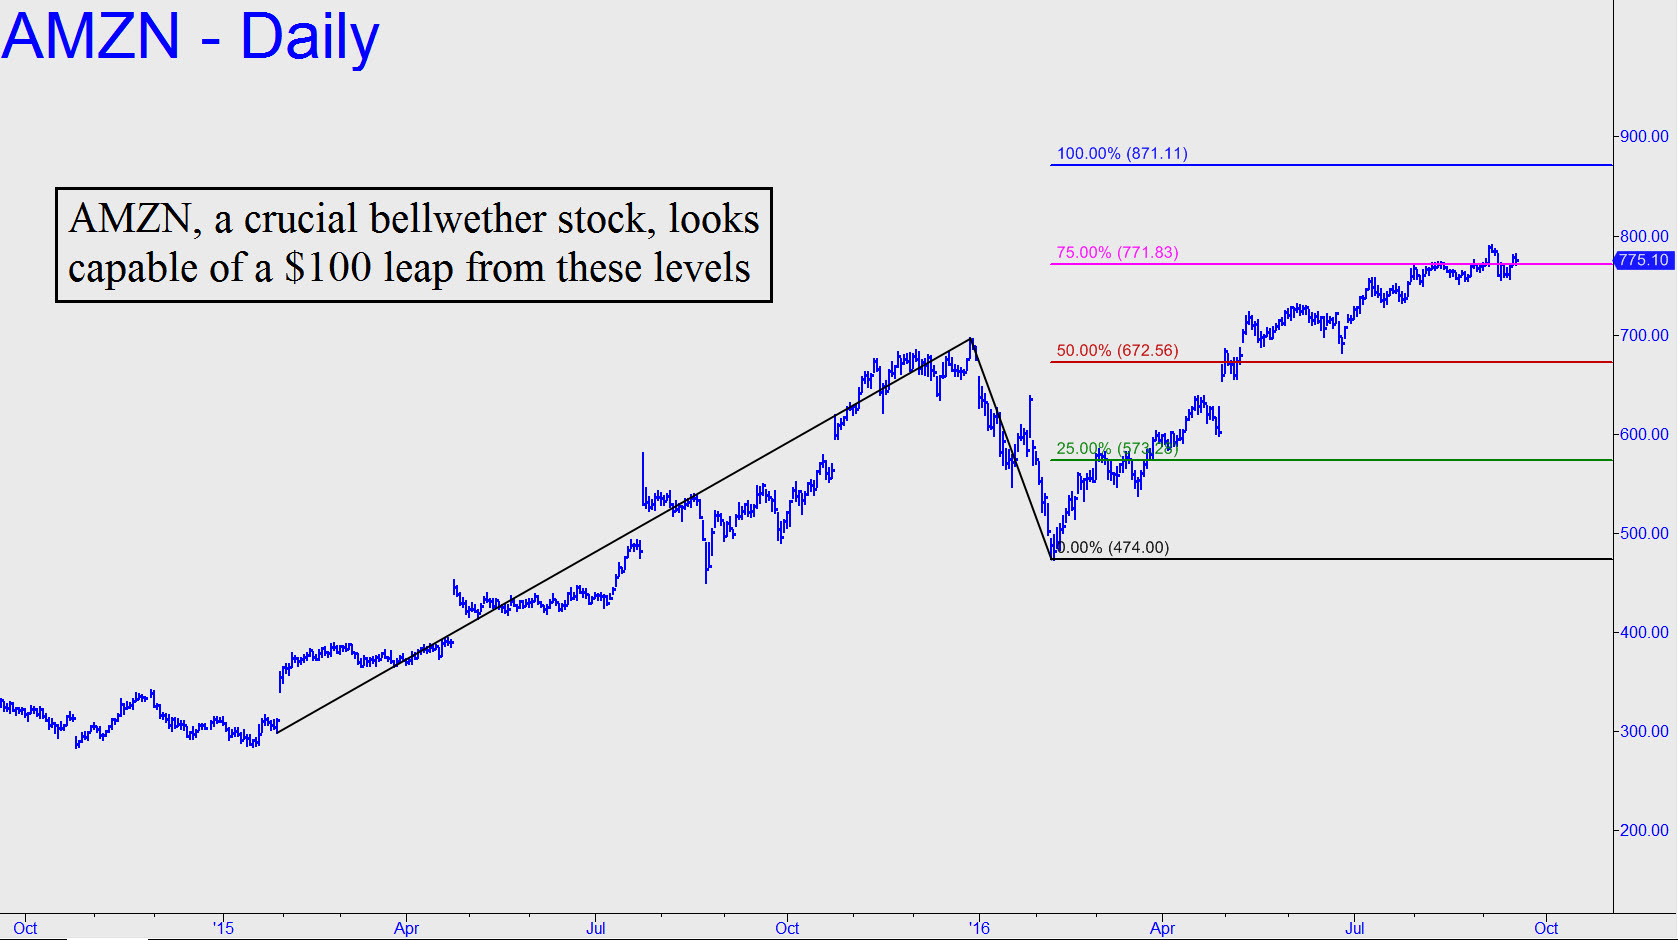
 Any permabear who is certain the stock market is about to roll over must first reckon with Amazon’s bullish chart. What it says, very clearly, is that this bellwether stock has a nearly $100 rally left in it before it hits a Hidden Pivot resistance that might stop the bull in its tracks. Even the $34 selloff earlier this month did not generate a bearish impulse leg on the daily chart — did no technical damage worthy of investors’ concern. That could change with a selloff that hits 750.34, a $25 fall from here that would turn the daily chart bearishly impulsive for the first time since June. That plunge was quickly recouped, and although there can be no guarantees that AMZN will do it again, neither would it conclusively affirm the onset of a full-blown bear market. ________ UPDATE (Sep 21, 5:31 p.m. ET): Up, up and away! Today’s $15 rally ended with a close decisively above the secondary pivot at 781.34. The stock can be bought mechanically with a 770.31 stop-loss if it returns to the pink line on either Monday or Tuesday. Price objective thereupon: 814.41. _______ UPDATE (Sep 22, 7:50 p.m.): A $25 surge in the last two days has put AMZN within spitting distance of the 814.41 target I’d projected above. Expect a potentially tradable pullback from that number today or early next week as bulls regroup for a climactic push to the 871.11 target of the even larger ABC rally pattern shown in the chart.
