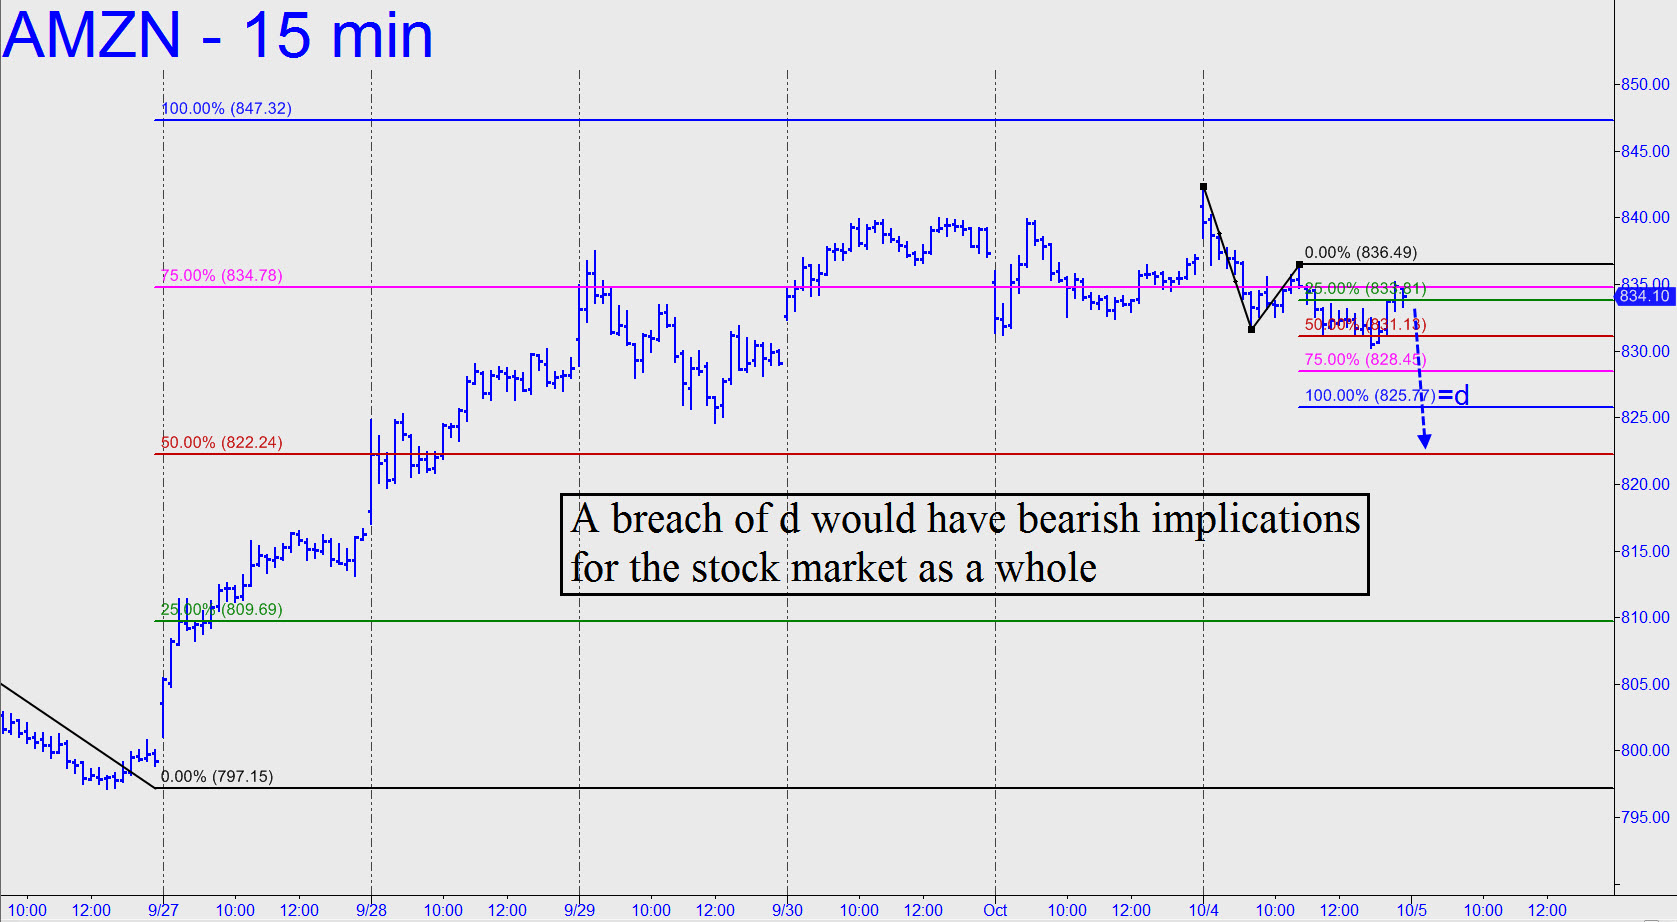
 I have bullish targets outstanding to as high as 871.11, but most immediately the stock will be bound for 833.90 if it can close for a second consecutive day above the red line. This projection is worthy of your attention because, as I noted here earlier, it is unlikely the stock market as a whole will be going down any time soon as long as Amazon, a key bellwether stock, is headed significantly higher. A pullback to p could conceivably set up a mechanical ‘buy’, stop 809.40, but only if the stock returns to p after having moved decisively above it, and stayed above it, for at least three consecutive days. This is a Hidden Pivot-based ‘mechanical’ trade, and I’d suggest tuning to the chat room in real time for guidance if the opportunity should ripen._______ UPDATE (Sep 29, 12:23 a.m. ET): Trade-desk lunatics and panic-stricken bears have inadvertently joined forces, pushing the stock toward my 833.90 target with meteoric force. The move has been tradable only at night, since most of AMZN’s upward progress has occurred via gap-up openings on nearly each and every day when the stock has moved higher. If 833.90 unexpectedly gives way easily, there is a coincident hidden resistance at 834.02 that is derived from these coordinates on the hourly chart: A=771.00 (9/19); B= 807.75 (9/23); C=797.27. The double target will act as a magnet until AMZN get there, then as a likely rally-stopper._______ UPDATE (8:11 p.m.): The stock reversed sharply, giving up nearly all of a $9 gain achieved on the opening bar. This is bearish on its face, but because the intraday high occurred above a crystal clear Hidden Pivot target at 834.02, we shouldn’t eulogize AMZN quite yet. In any event, we’ll watch from the sidelines today — specifically, for minor, downtrending abc patterns that exceed their d targets. That would be warning of a possible major reversal from Thursday’s top._______ UPDATE (Oct 2, 4:06 p.m.): The 871.11 rally target we’ve been using remains valid, but let’s focus for the moment on a lesser one at 847.44. For trading purposes, here are the coordinates to produce Hidden Pivot levels for ‘mechanical’ and/or ‘camouflage’ entry strategies: 240-minute, A=757.58 (9/15); B=807.75 (9/23); and C=797.27. FYI, p lies at 822.36, and p2 — a;ready decisively exceeded, at 834.90._______ UPDATE (Oct 4, 10:15 p.m.): The yellow flag is out, since AMZN reversed a bull-trap opening this morning after falling $5 shy of our target. Adding to the bearishness was the impulse leg that the downtrend created on the intraday charts (see inset). It projects to 825.77, and if that Hidden Pivot support is breached, it would have bearish implications not only for AMZN, but for the broad averages which this super-stock has help keep buoyant._______UPDATE (Oct 5, 1027 p.m.): We shouldn’t have doubted the stock or its manic sponsors when it dipped sharply for a day. The whipsaw, punctuated by today’s wicked rally, has left the 847.32 rally target intact.
