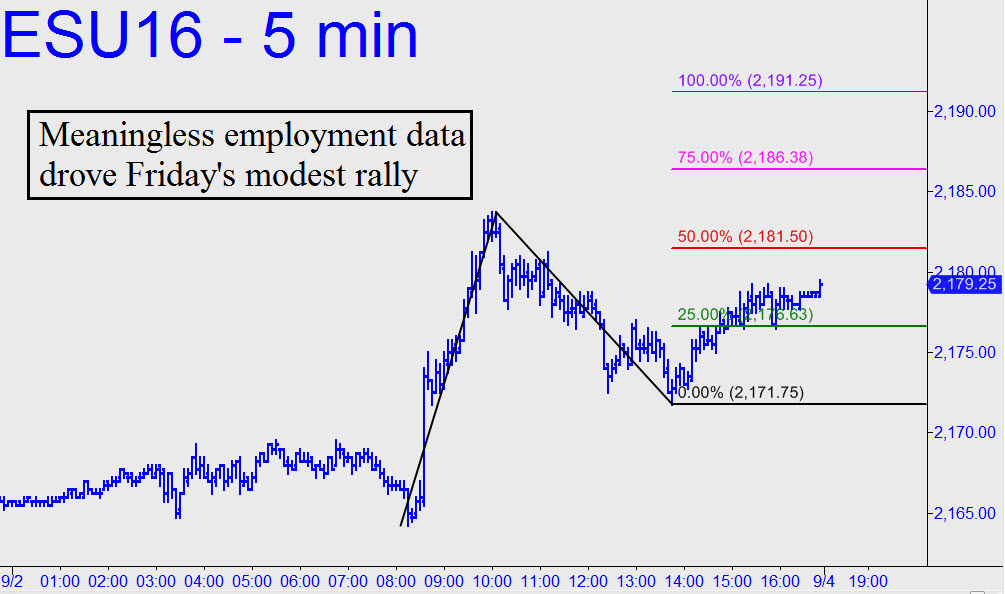
 Friday’s modest rally, fueled by meaningless non-farm payroll data, was bound for 2191.25 (see inset) when the bell rang. This target roughly coincides with an important midpoint resistance at 2189.25 associated with a larger pattern that projects to as high as 2236.75 (60-minute, A=2082.00 on 7/7). That implies double stopping power near 2190, and any rally that exceeds this number is to be presumed backed by considerable buying power. Still more bullish would be a two-day close above 2189.25, an occurrence that would make a further push to 2236.75 an odds-on bet. I’ll switch to the relevant chart when appropriate, but your trading bias for the time being should be bullish. _______ UPDATE (September 7, 4:55 p.m. EDT): No change. The minor, 2191.25 target given above is not only still viable, the odds have increased that it will mark a top of at least short-term importance that could be precisely tradable. This is implied by Tuesday’s stall a half-tick from the 2186.38 ‘secondary’ pivot shown in the chart. If you’ve been long for the ride north, use your profits to cushion a generous stop-loss when you reverse the position at the target. Remember, any minor rally target could mark an important top, and that’s why opportunities like this one should be exploited aggressively, albeit with entry risk very tightly controlled.
