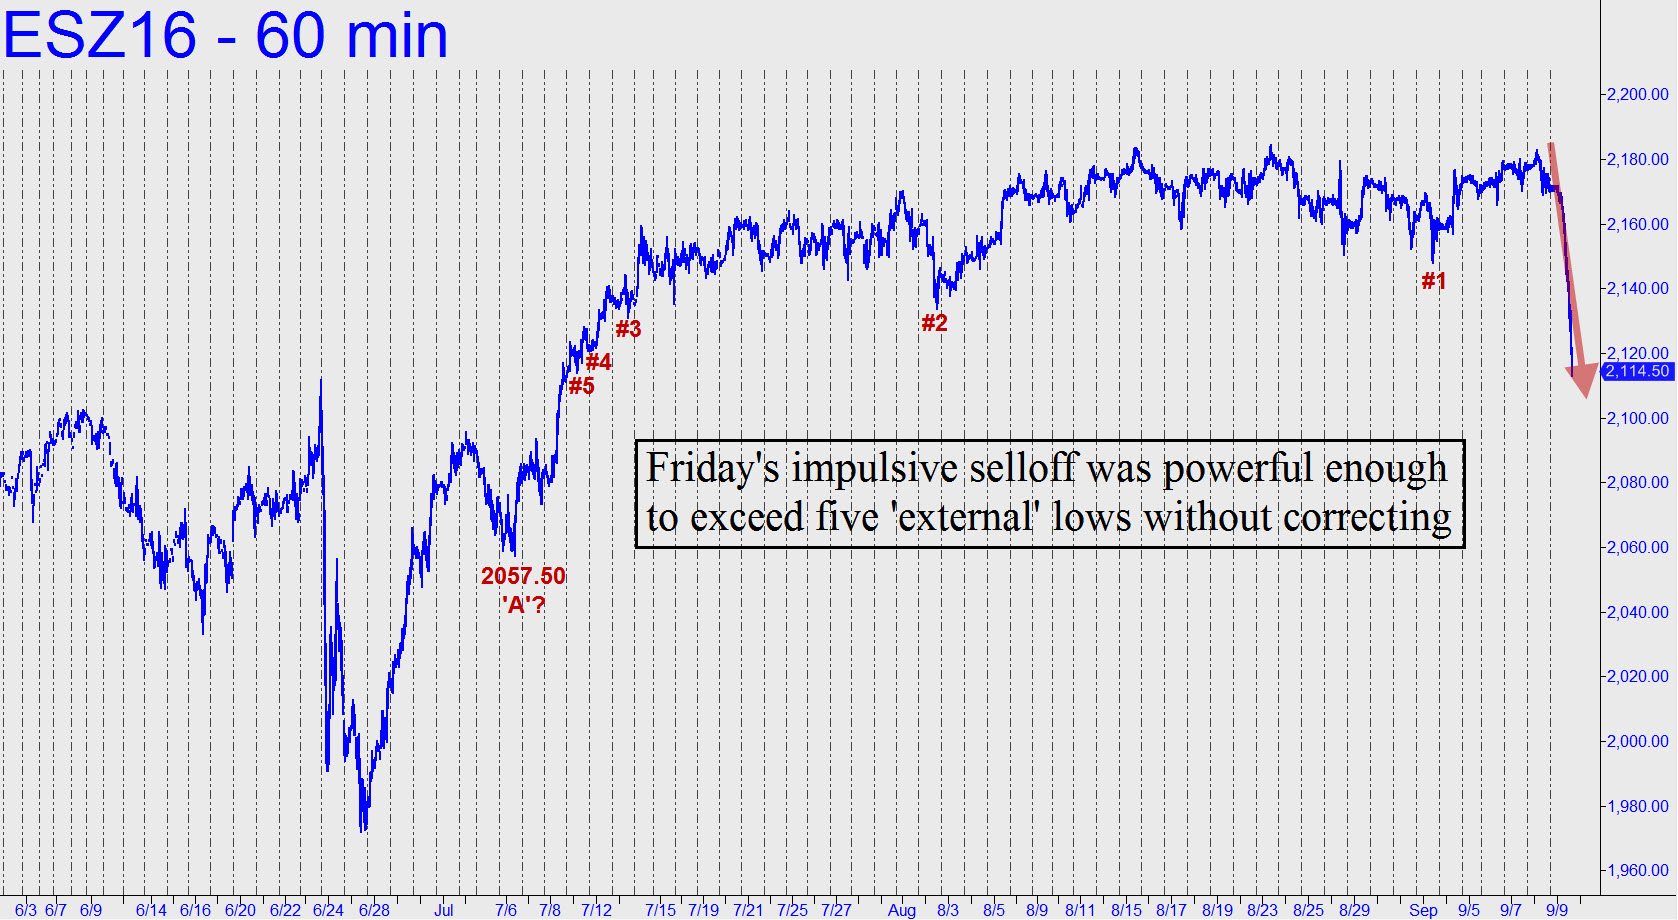
 Friday’s plunge did significant technical damage to the E-Mini S&P’s daily chart. The last time this occurred was ostensibly due to Brexit hysteria and all of the scare-mongering by one-worlders that attended the vote. This time, however, stocks fell for no apparent reason, and that should be worrisome for bulls, since it suggests that cyclical forces are at work that could spell doom for a bull market currently in its 90th month. As you can see in the chart (inset), the steep selloff exceeded no fewer than five ‘external’ lows, two of them major, without an upward correction. This implies there is very considerable power driving the selling and that it is likely to continue following whatever upward correction awaits. If the bounce occurs from somewhere above the 2057.50 low labeled in the chart, it could conceivably generate a ‘counterintuitive’ buy signal that day- and swing-traders could use. However, we’ll need to monitor the bounce closely on the lesser charts, since a failure to push past even a minor ‘midpoint Hidden Pivot’ resistance would be warning that the larger downtrend is still in effect.
