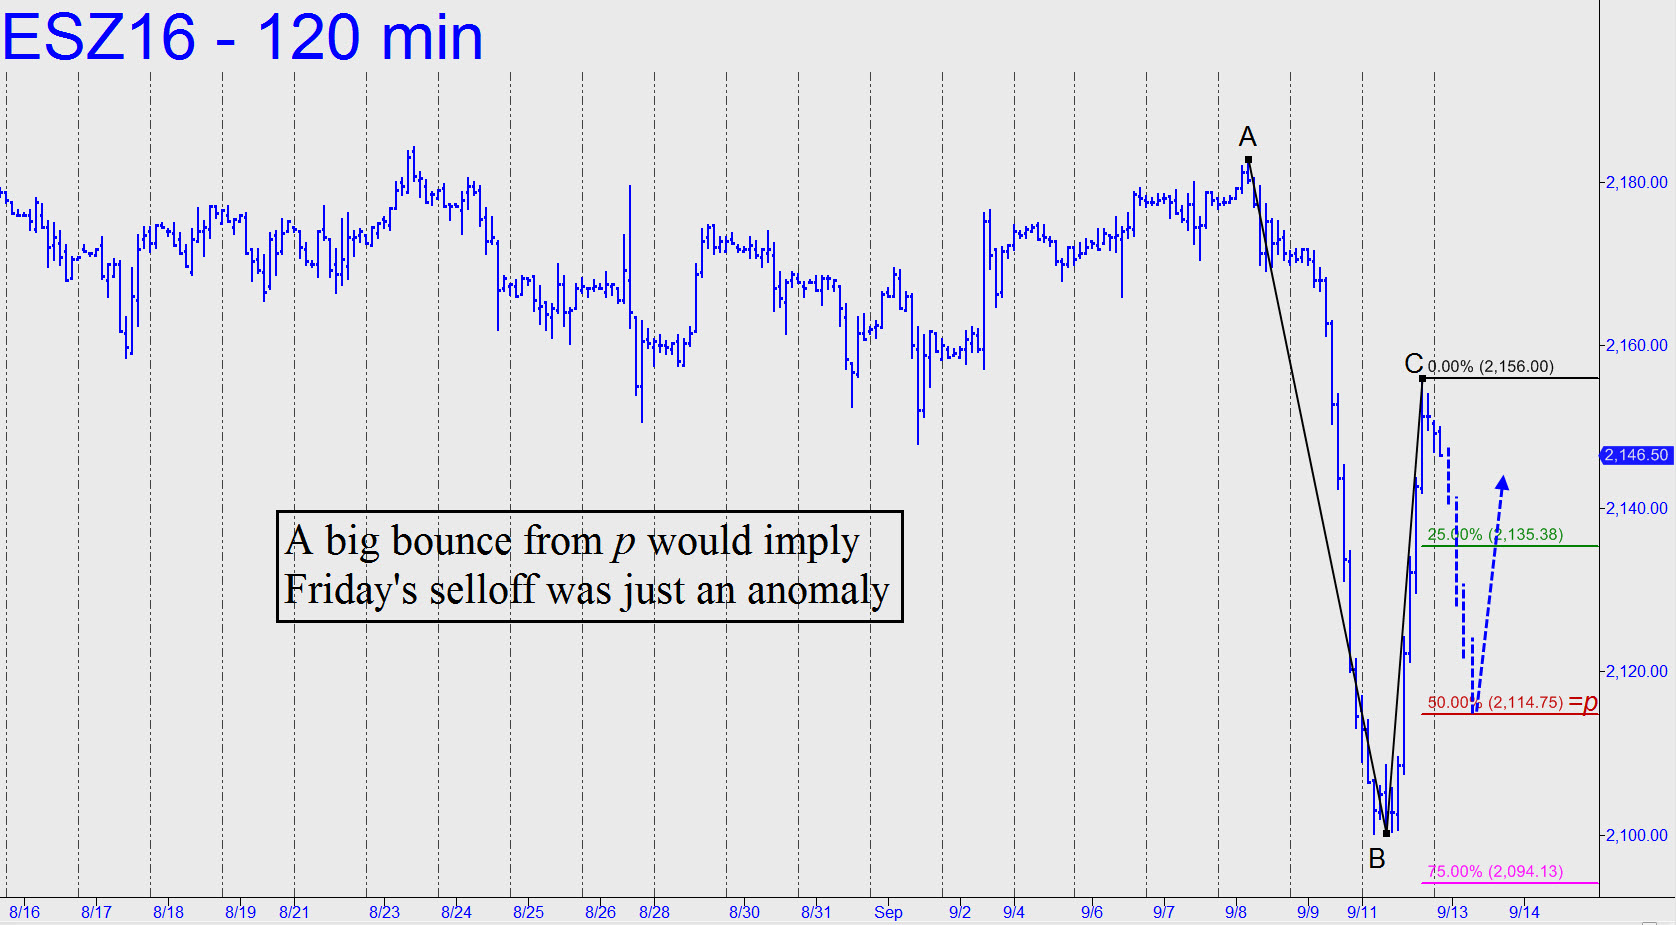
 I had said that any rally from Friday’s bombed-out low would be a short sale. Well, here we are, 40 points off the bottom, but not exactly looking to jump in the path of a full-blown bear panic. My gut feeling is that a tradable pullback from somewhere shy of new record highs still awaits. Indeed, the 15-minute chart suggests that the pullback will come from 2163.50 exactly (A=2110.50 on 9/12 at 9:45 a.m. EDT; B=2143.50 at 1:30 p.m.) But unless you are looking for excitement, I’d plan on monitoring the pattern shown, since a bounce from p (as yet undetermined) would imply bulls are ready to resume their dominance following Friday’s scare. In the meantime, night owls who are comfortable with the tactic can use the 15-minute pattern noted above to effect a ‘mechanical’ buy from any of the three Hidden Pivot levels — x=2138.75; p=2147.00; or p2=2155.25._______ UPDATE (September 13, 9:40 a.m. EDT): After falling hard overnight, the futures have tripped a theoretical short from 2135.38 this morning. The ‘undetermined’ Hidden Pivot midpoint-to-watch I alluded to above is 2114.75. That is my minimum downside projection at the moment, and a bounce from it is crucial if bulls are going to avert a second-wave selloff down to as low as 2073.50. Alternatively, Monday’s vicious short-squeeze rally would get second wind if the futures reverse this morning and surpass 2147.00. ______UPDATE (2:32 p.m.): Is the 2.50-point overshoot of the 2114.75 target given in my tout update five hours ago (see above) sufficient for us to infer that the 2073.50 ‘D’ target is in play? Not quite, especially since there were multiple possibilities for the point ‘A’ high of the pattern. Give me a print at 2019 or so, though, and I’d rate D no worse than an even-odds bet to be reached.
