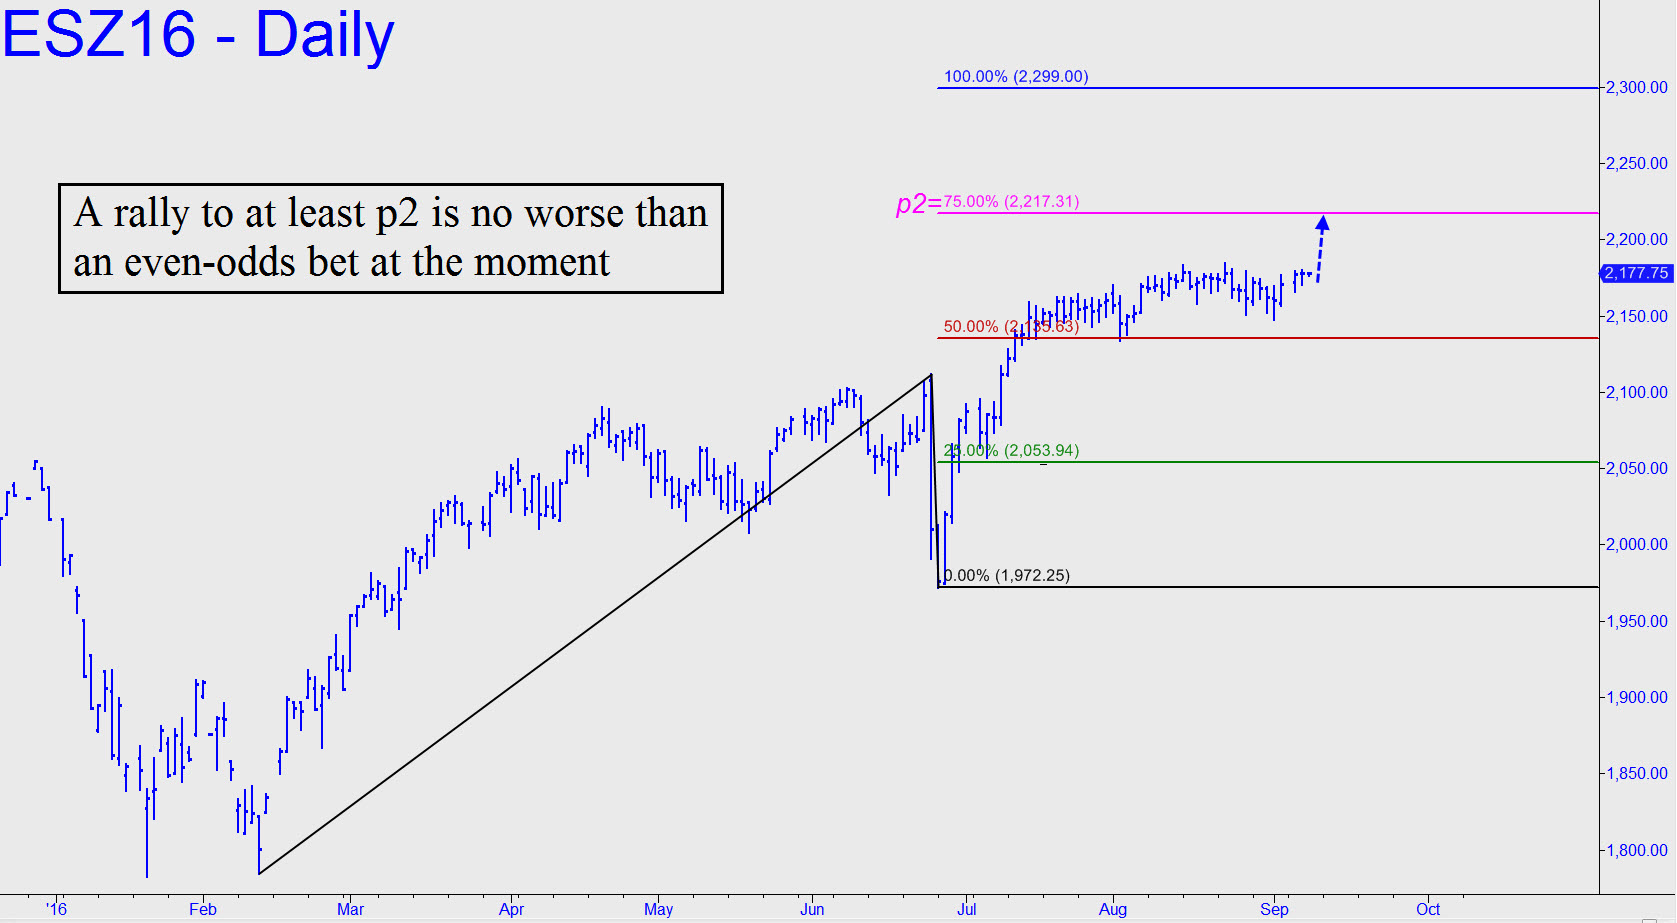
 DaBoyz have returned from the Hamptons, only to hit the ground crawling. With today’s dirge, they’ve succeeded in extending the summer snoozefest yet one more day. Doubtless, they are waiting for some momentous announcement about imminent tightening from the Fed. Even if the announcement doesn’t come, the hacks who report the news seem to have bought into the rate-hike scenario wholeheartedly and are eagerly complicit in Yellen’s embarrassing attempts to ‘manage’ our expectations. None of this changes the ostensibly bullish picture of the E-Mini S&Ps’ daily chart. I say ‘ostensibly’ because the slope of the rally toward a 2299.00 target is so subtle that it could take another eight months to get there if the pace doesn’t pick up. Although a serious correction is long overdue, there is nothing in the chart to suggest the target will not be reached. The August 2 pullback to the red line provided a perfect ‘mechanical’ buying opportunity that never challenged bulls even slightly, and the 2217.31 ‘secondary pivot’ looks, if not quite like a lock-up, then at least no worse than an even-odds bet to be reached. More immediately, traders can use this pattern on the 15-minute chart to get long overnight with just three ticks of theoretical risk: a=2180.00 (9/7 at 10:45 a.m. EDT); b=2170.50; c=2178.75 (4:00 p.m.). Assuming point ‘c’ has not been exceeded, you should bid a tick above p=2174.00, stop 2173.50. You’ll be on your own if this one fills, but the three-tick initial stop-loss implies a partial-profit-taking opportunity at 2175.75.
