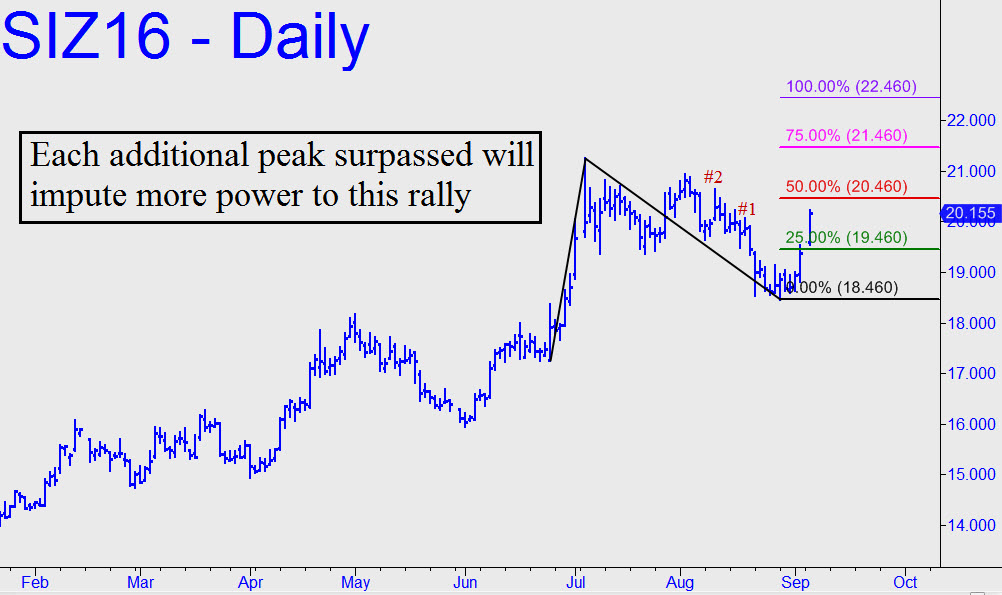
 Today’s strong rally surpassed two external peaks on the daily chart, implying there’s real power behind it. Even so, buyers will need to torpedo a midpoint Hidden Pivot resistance not far above, at 20.460, to suggest they’ve got the wattage to power this vehicle to the pattern’s 22.460 target. A pullback to the green line in 2-3 days would trip a ‘mechanical’ buy, stop 18.455, but we’ll convert any such signal into a less risky ‘camouflage’ entry if the opportunity should arise. _______ UPDATE (September 7, 8:22 p.m. EDT): Today’s high exceeded Tuesday’s by only a few ticks, but that was sufficient to take out yet another external peak on the daily chart — August 16’s 20.220. This effectively refreshes the bullish energy of the chart and shortens the odds that any weakness in the next few days — assuming there is weakness — is merely corrective and should be bought._______ UPDATE (September 8, 8:56 p.m.): 19.600 is my immediate downside target on the 5-minute chart: a=20.235 (9/6); b=19.815 (9/7); and c=20.020, but if it’s exceeded by more than three ticks, the next place we might look for a bounce is from 19.450; or thence, 19.385. You can bottom-fish that last Hidden Pivot, also drawn from the 5-minute chart (a=19.950 at 9:40 a.m.) with stop-loss as tight as four ticks.
