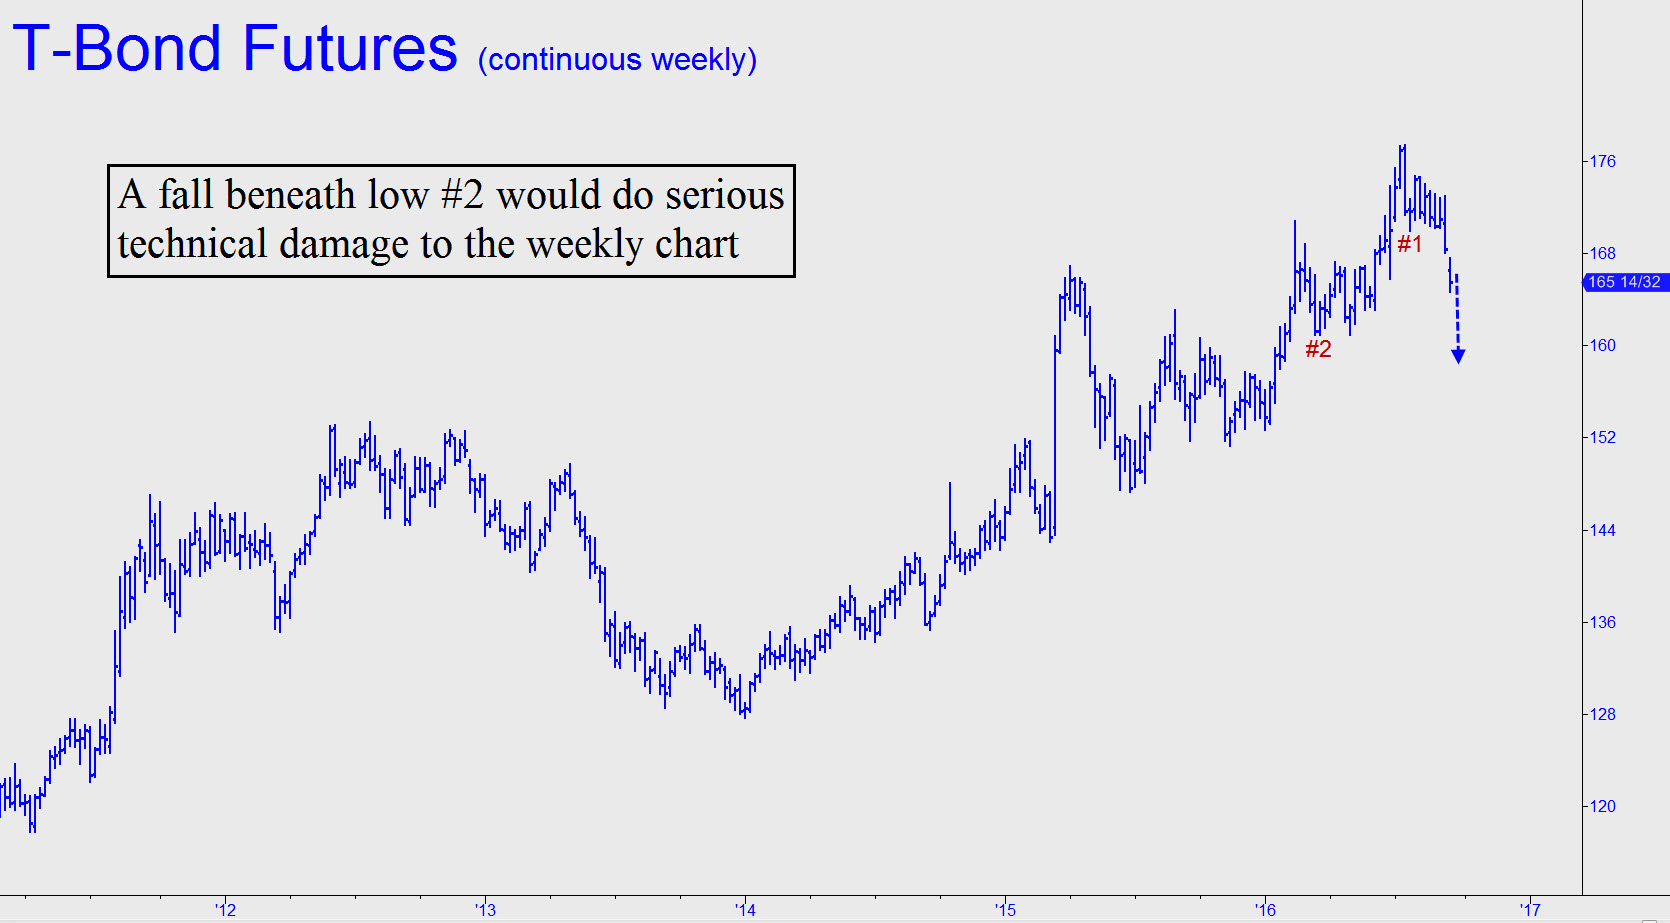
 As painful as the correction from mid-July’s 177 peak might seem, it has caused no technical damage whatsoever to a monthly chart that stretches back 15 years. The weekly chart is another matter, however, since the downtrend has already breached an ‘internal’ low at 169^31 recorded in July. This falls shy of generating a bearish ‘impulse leg’, but if the selling were to continue, exceeding an ‘external’ low at 160^30 recorded back in March, that would ratchet up the seriousness of the correction by an order of magnitude. It would not affect my prediction that yields on the 30-year bond, currently around 2.47%, are headed to 1.64%, or possibly even 0.6% (!), but it could delay the fulfillment of the first target by as much as 6-12 months. We’ll let the charts speak for themselves as this presumptive correction develops, but I very seriously doubt that T-Bonds have entered a bear market.
