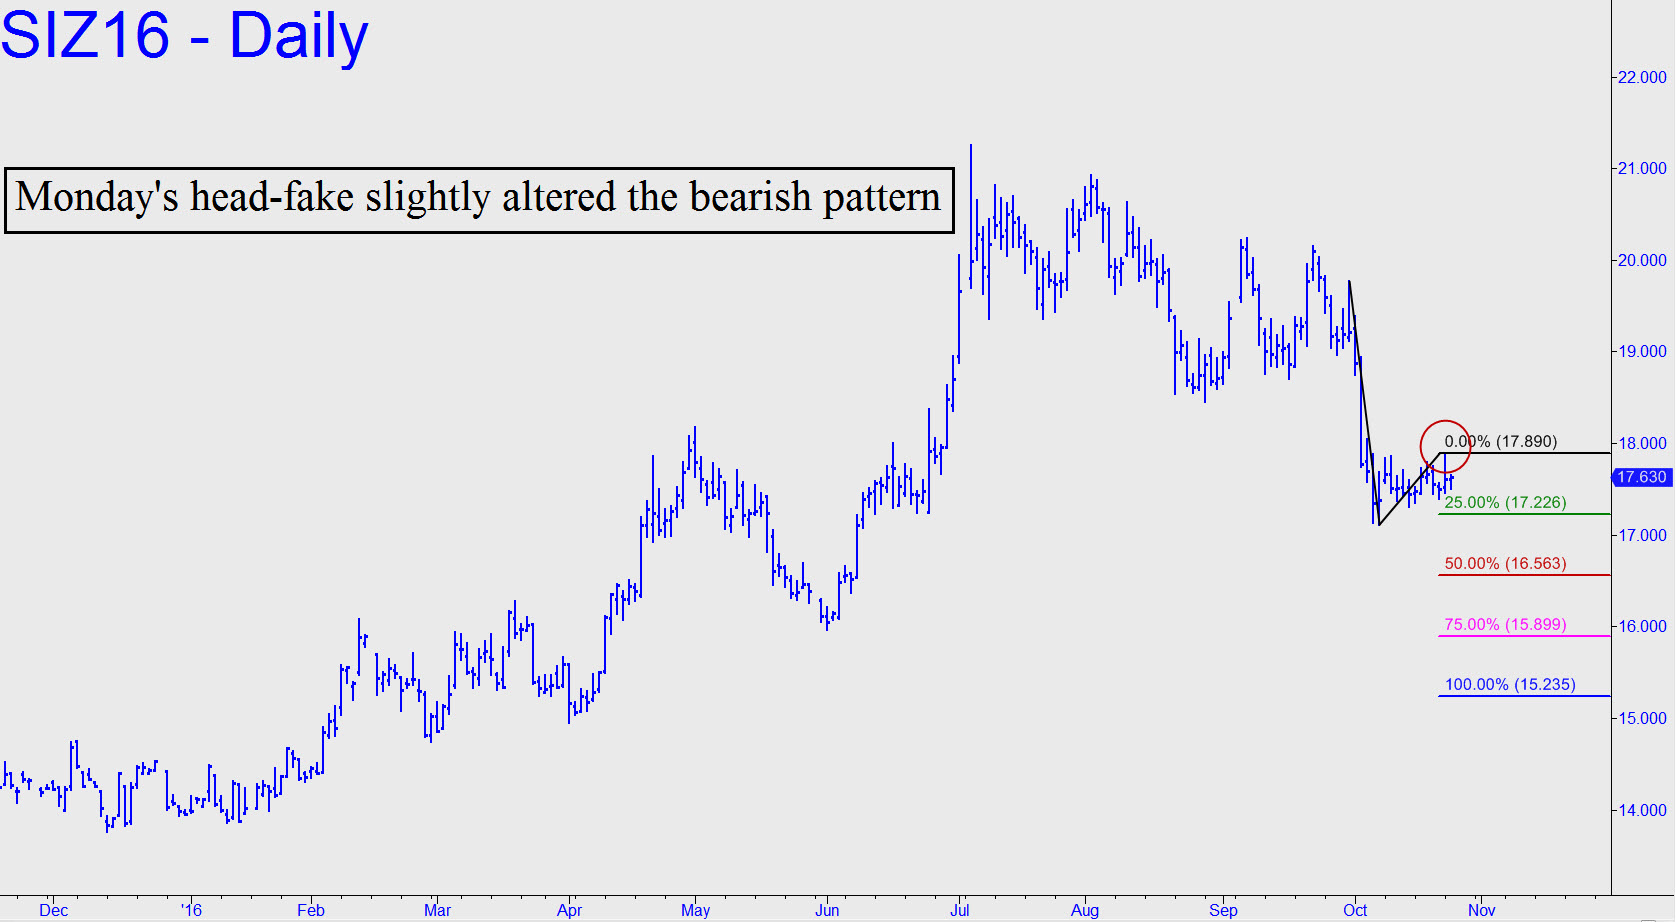
 With just a little more slippage to the green line, December Silver would trip a theoretical sell signal to 15.225. If that target were to be achieved, it would represent a 28.5% correction from the 21.250 recovery high recorded on July 5. So far, the correction has amounted to about 20%, the accepted threshold for a bear market. Even if a reversal should come from the 16.528 midpoint Hidden Pivot of the pattern shown, it would not negate the damage done by the bearish impulse generated two weeks ago by the breach of June’s key low at 17.250. The bull market from January’s lows would still be intact, but that would be scant consolation to those who have hung tough since July or bought on the way down. Tightly stopped bottom-fishing at the red and pink lines, p and p2, would be indicated here, since either is a logical place for a significant upturn to occur if the larger bull market is still viable. But even then there would be no guarantees. Alternatively, and most immediately, it would take a rally this week exceeding 17.880 to offer the barest hint of a turnaround. _______ UPDATE (Oct 18, 6:42 p.m.) A ‘reprieve rally’ created a minor, bullish impulse leg on the intraday charts, but then went nowhere. Bulls will need to push this brick above 17.695 today — or better yet, close above it — to get something going. ________ UPDATE (Oct 23): Silver futures are about to enter a third week of tedium so stultifying that price movement could be referred to as vibrations rather than swings. _______ UPDATE (October 24, 11:08 p.m.): Yesterday’s bull-trap rally created a slightly higher point ‘C’, so I’ve changed the chart to reflect this. The new minimum downside target will be p=16.563, assuming the futures don’t fake their way to yet another high before hitting the green line ‘trigger’.
