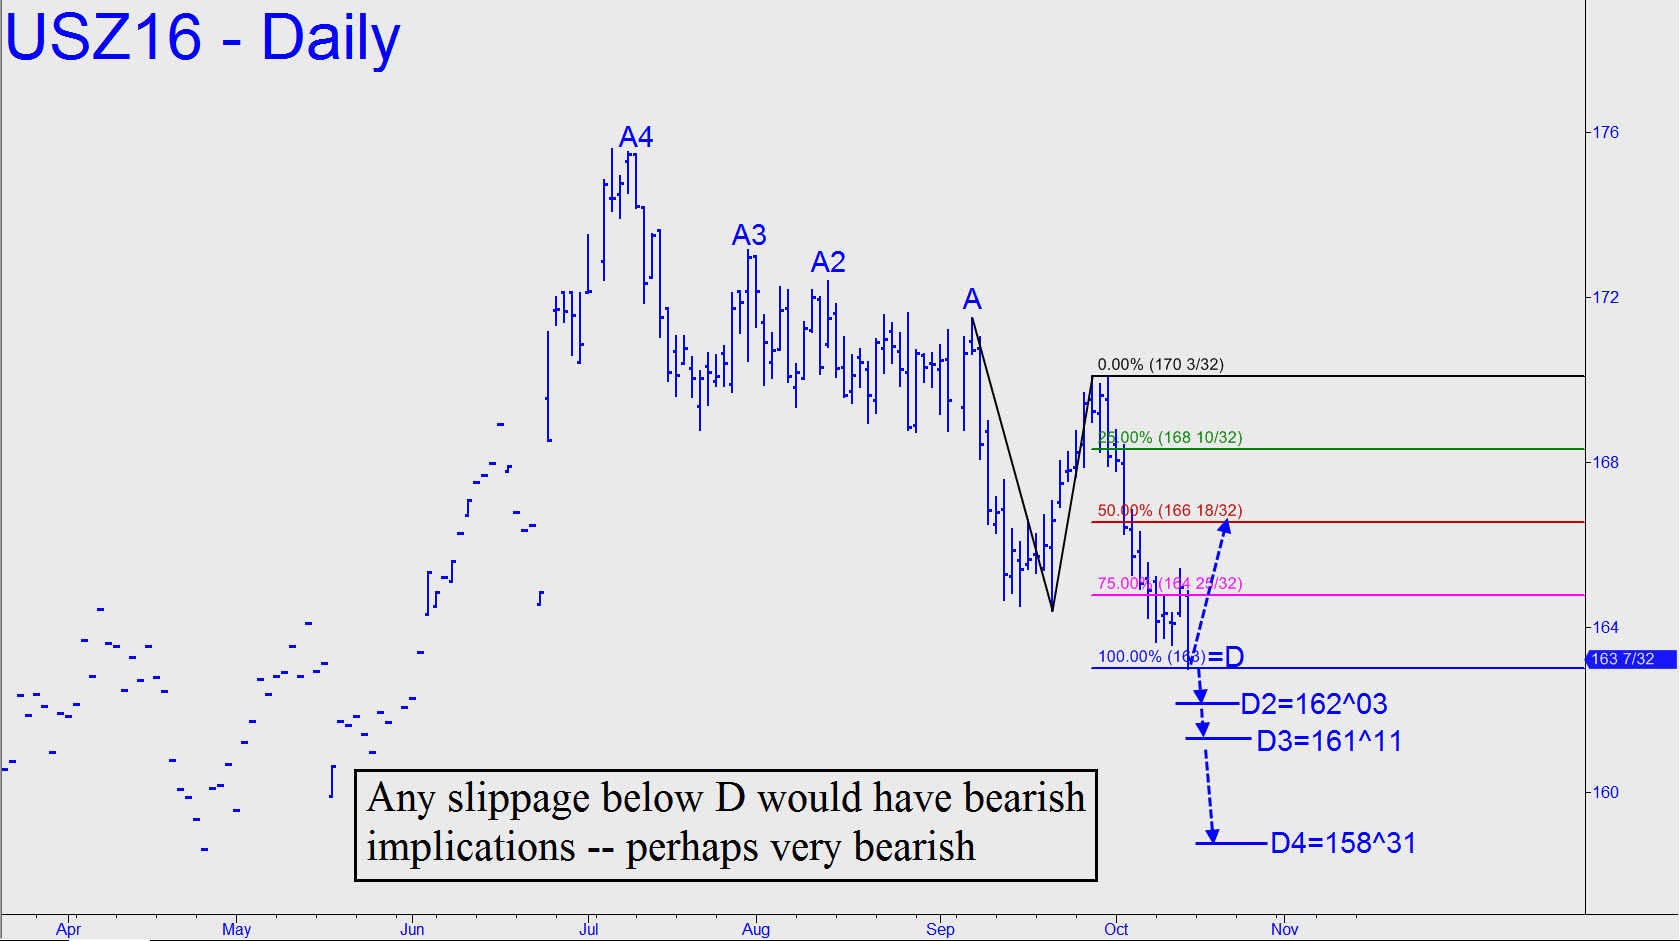
 The futures bounced precisely on Friday from a very crucial Hidden Pivot support at 163^00. The reversal was weak, however, and if the support fails decisively in the days ahead — meaning, fail by at least seven ticks — we could expect the decline to continue to at least 162^03. That’s a ‘D’ Hidden Pivot target calculated by sliding point ‘A’ up to the 172^13 peak recorded on August 12. There would still be room for the futures to achieve two even lower targets. The first, at 161^11, is based on A=173^05 on July 29. At that point, the presumptive correction will have all but maxed out projections for the daily chart, save for a bear-market target 158^31 that comes from July 8’s 175^17 high. Since that high is such a picture-perfect one-off ‘A’, we shouldn’t discount the possibility that it will determine the final low for what has already been a very substantial correction. The corresponding increase in yields on the 30-Year would be to 2.658%, up from a current 2.555%. That would still be low by historical standards, but it would be a back-up-the-truck number as far as I’m concerned for buying more T-Bonds. We would be seeking to leverage a massive rally that presumably would be the final phase of a bull market in long-term T-Bonds that began in 1982. _______ UPDATE (Oct 17, 8:5 p.m. ET): A feint down to 162^19 exceeded my bearish threshold by nearly half a point, putting a new target at 162^02 in play whose provenance is detailed above. Alternatively, it would take a rally to at least 165^19 to even hint that bulls are capable of going on the offensive. _______ UPDATE (Oct 27, 10:26 p.m.): Sellers crushed the 162^02 Hidden Pivot support, putting a new target at 159^16 in play. Worst case would be 157^28, calculated by sliding ‘A’ up to Sep 30’s 170^01 high. This may coincide with a potentially VERY important target at 2.658% for yields on the 30-year. Check out the TYX tout below for explicit details and a chart.
