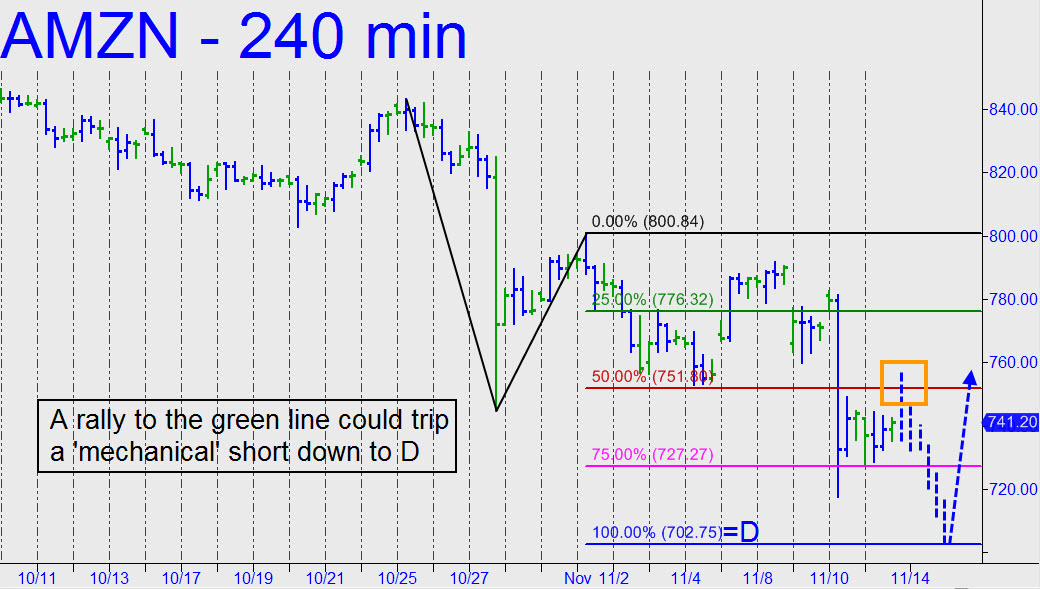
 The pattern shown projects more downside to 702.75, a Hidden Pivot support that is less bearish than the one at 686.94 proffered here on Friday. Notice the strong bounce precisely from the red line. That’s the pattern’s midpoint pivot, and this kind of price action suggests that an equally precise — and presumably tradable — bounce will occur if and when D=702.75 is hit. If a rally back up to the red line occurs first, that would trip a ‘mechanical’ signal to get short there, stop 768.15. Since that implies about $1700 of theoretical entry risk, I’d suggest initiating the trade using ‘camouflage’. This implies shorting a downtrending abc pattern on the lesser (i.e., three-minute or lower) charts after the red line is hit. Tune to the chat room for real-time guidance if you’re unfamiliar with this tactic and want to learn more about it. _______ UPDATE (Nov 15, 7:52 p.m.): AMZN has bounced without having quite reached the 702.75 target given above. That’s prospectively bullish, but it would become explicitly so if the stock is able to rally past a few recently formed external peaks that lie just above Tuesday’s high. Regardless, the stock is already a very appealing camouflage ‘buy’ on the 15-minute chart. Click here for a look.
