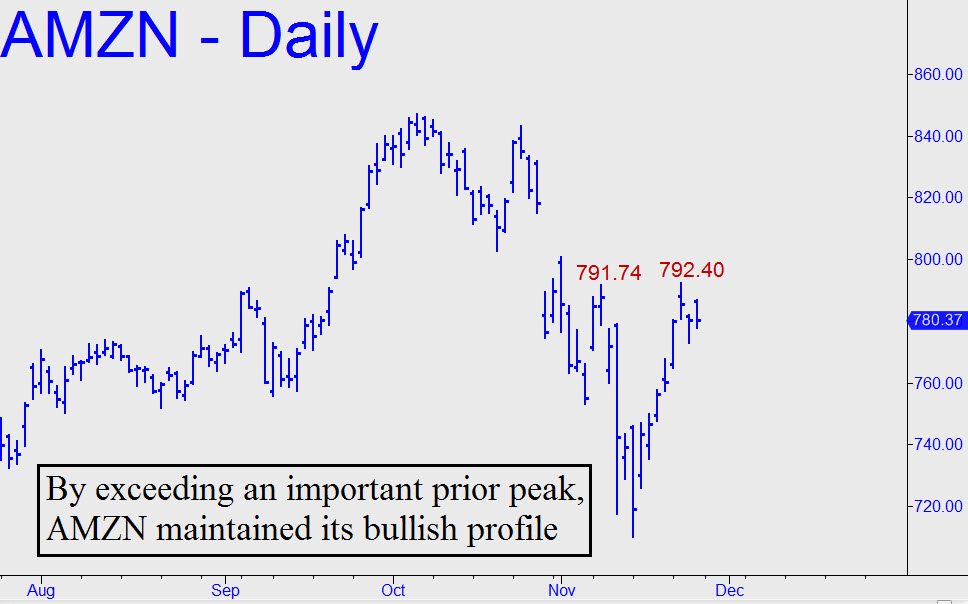
 Our all-but-infallible stock market bellwether did everything we asked of it on Tuesday and more, exceeding a 789.77 rally target that had served as a lodestar for any trader keen on betting the pass line. The stall at 792.40 was no coincidence, as you can see (inset). It occurred just 25 cents from the 792.65 midpoint Hidden Pivot resistance of a bullish pattern that traces back to early July. If and when the stock pushes decisively past it — meaning by at least $15 or so — an 875.20 target will be well in play. In the meantime, let’s look for entry opportunities from any of the Hidden Pivot levels denoted by the green, red and pink lines. First, though, this world-beater will need to push past 792.65 — or more bullishly still, close above it for two consecutive weekly bars. At that point the target would be a lock, and Amazon’s rally will be powerful enough to drag the broad averages along with it. ________ UPDATE (Nov 27, 10:04 p.m. EST): AMZN failed last week to push above the 792.65 pivot flagged above, but it nonetheless topped a key ‘external’ peak at 791.74 recorded on November 8 (see inset, a new chart). That makes the rally bullishly impulsive and worthy of our continued attention, since the stock has the power to drag the broad averages higher with it. ______ UPDATE (Nov 29, 7:06 p.m.): A boring day in this stock may have set the tone for the stock market as a whole on Tuesday. Even so, just a little slippage on Wednesday could start generating minor sell signals on the hourly chart. If you’d like to try shorting the stock, check out the smorgasbord of external lows recorded between Nov 16-18. They are tailor-made for our purposes.
