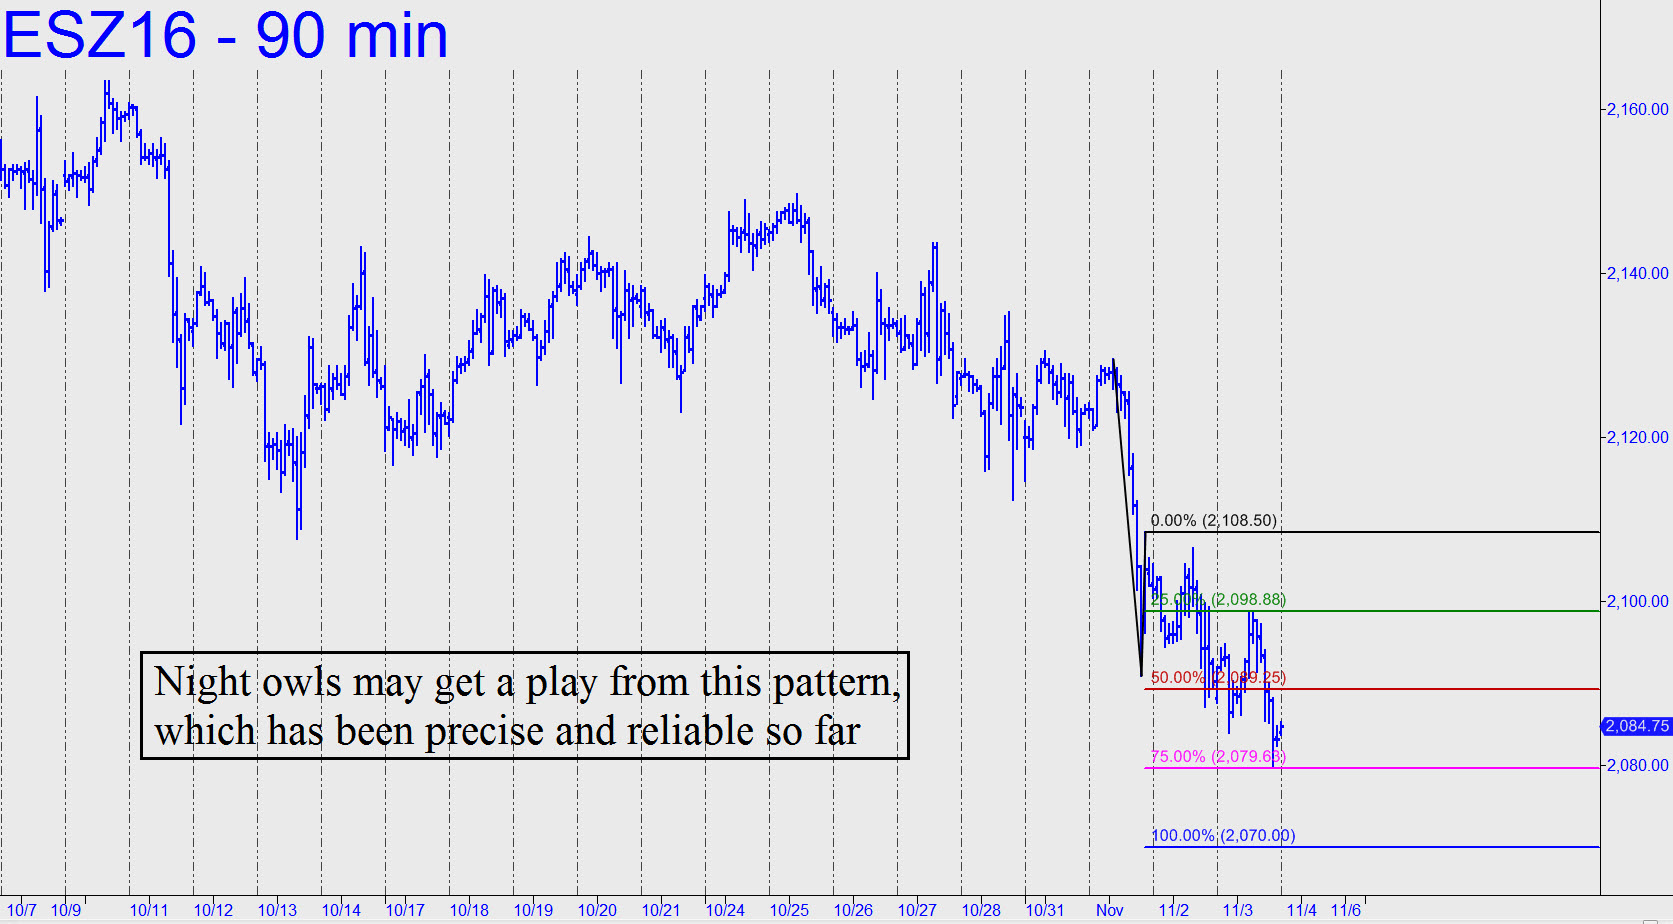
 Sellers had such a hard time pushing this erstwhile cinder block down to a modest ‘secondary’ target on Thursday that I rechecked my calculations to see what the problem was. Sure enough, I’d used an erroneous point ‘C’ high. The new chart shows the true downtrending pattern that is controlling the futures at the moment. Notice that it has picked up a dead-center-bullseye hit at p2=2079.63. The original Hidden Pivot support was given as 2077.63, but the chart shown is the correct schematic. It provided a very precise ‘mechanical’ short from the green line (x), and — night owls take note — I expect it to do the same from the red line (assuming the futures don’t fall straightaway to D=2070.00). That last number can be bottom-fished with a 2070.25 bid, stop 2069.25 (!), but I recommend the trade only to those who have captured at least a few points of profit on the way down. As always, a decisive breach (i.e., more than three ticks here) of D would imply more weakness to come, presumably after a bounce of indeterminate strength.
