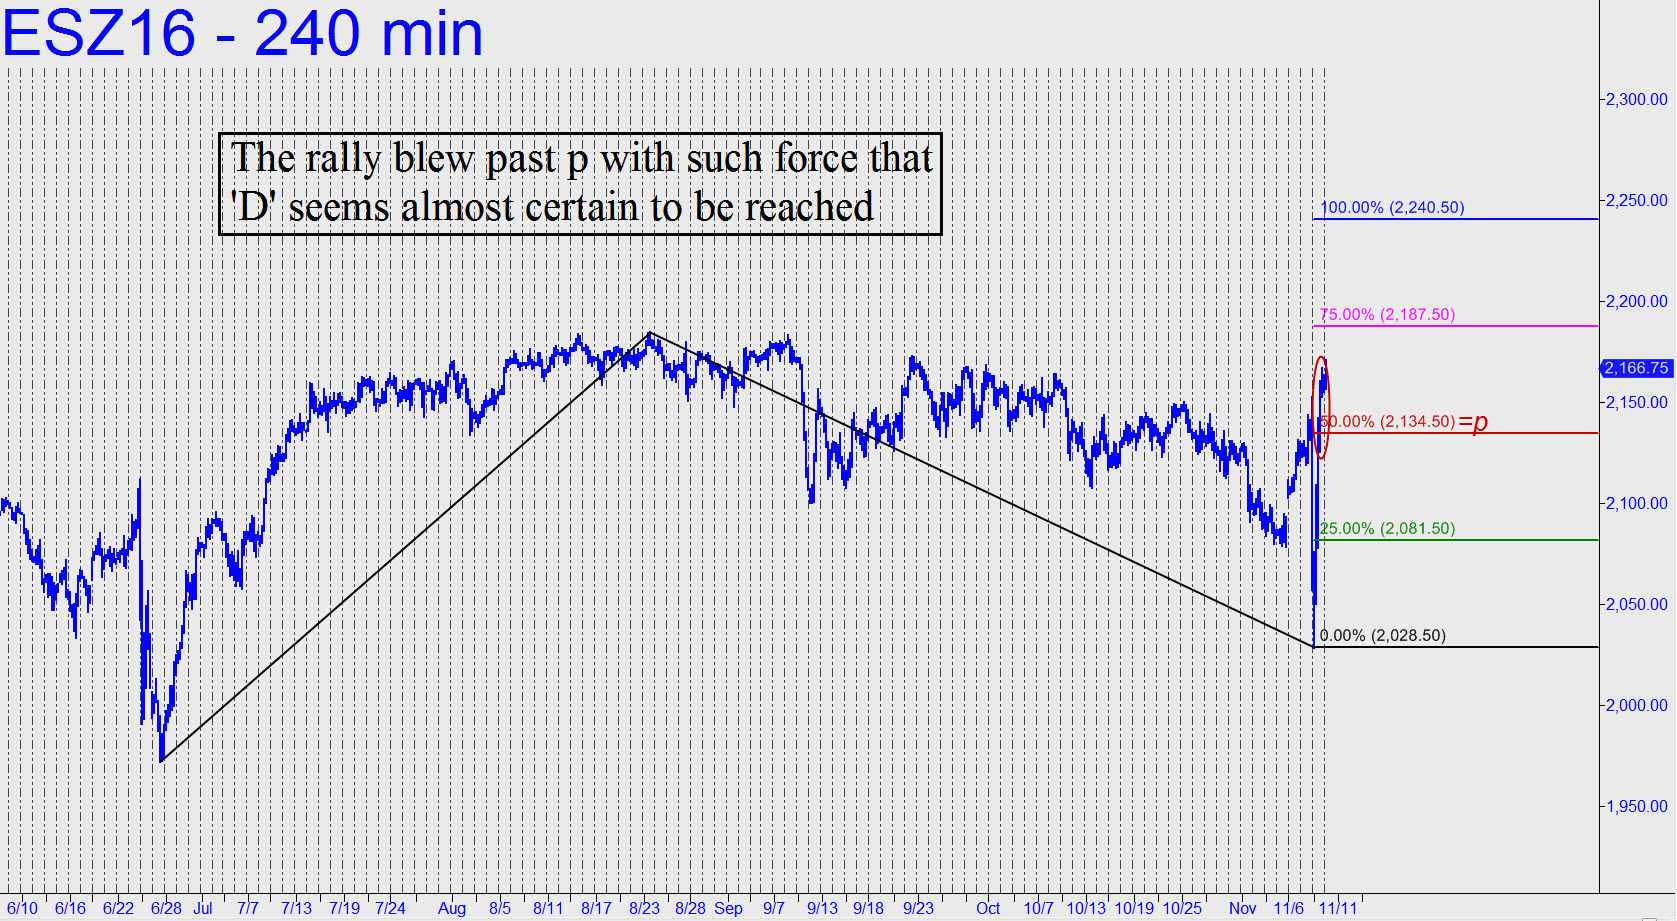
 Wednesday’s manic, 142-point trampoline bounce blew past the 2134.50 midpoint pivot of the pattern shown with such force that the futures appear almost certain to achieve its 2240.50 target. Measured from Tuesday night’s bombed-out low, that would be equivalent to a Dow rally of about 1700 points. The target does not match up precisely with any rally target I’ve flagged in my DJIA tout (see below), so we’ll have to look at each separately and trade them accordingly. A pullback to the red line would be a ‘mechanical’ buy in theory, but buyers shouldn’t count on bargains, considering the very steep trajectory of the rally. The best way to board may be via a ‘timed buy-stop’, a tactic that is probably the least-used of the five tactics associated with the Hidden Pivot Method. It works best when a trend is so powerful that it keeps going even when there’s a herd of profit-taking bulls aboard who have been enticed by the steep, but dangerously obvious, pitch of the rally. ______ UPDATE (Nov 10, 8:59 p.m. ET): For Friday, use 2180.75 as a rally target. It is the ‘D’ Hidden Pivot of this very gnarly pattern on the 10-minute chart: A=2147.50 (1:30 p.m. on 11/9); B=2180.50 (3:30 a.m. on 11/10); and C=2147.75. Notice that the pattern tripped a ‘counterintuitive’ buy signal at 2156.00, ‘C’ having been a single tick higher than ‘A’.)
