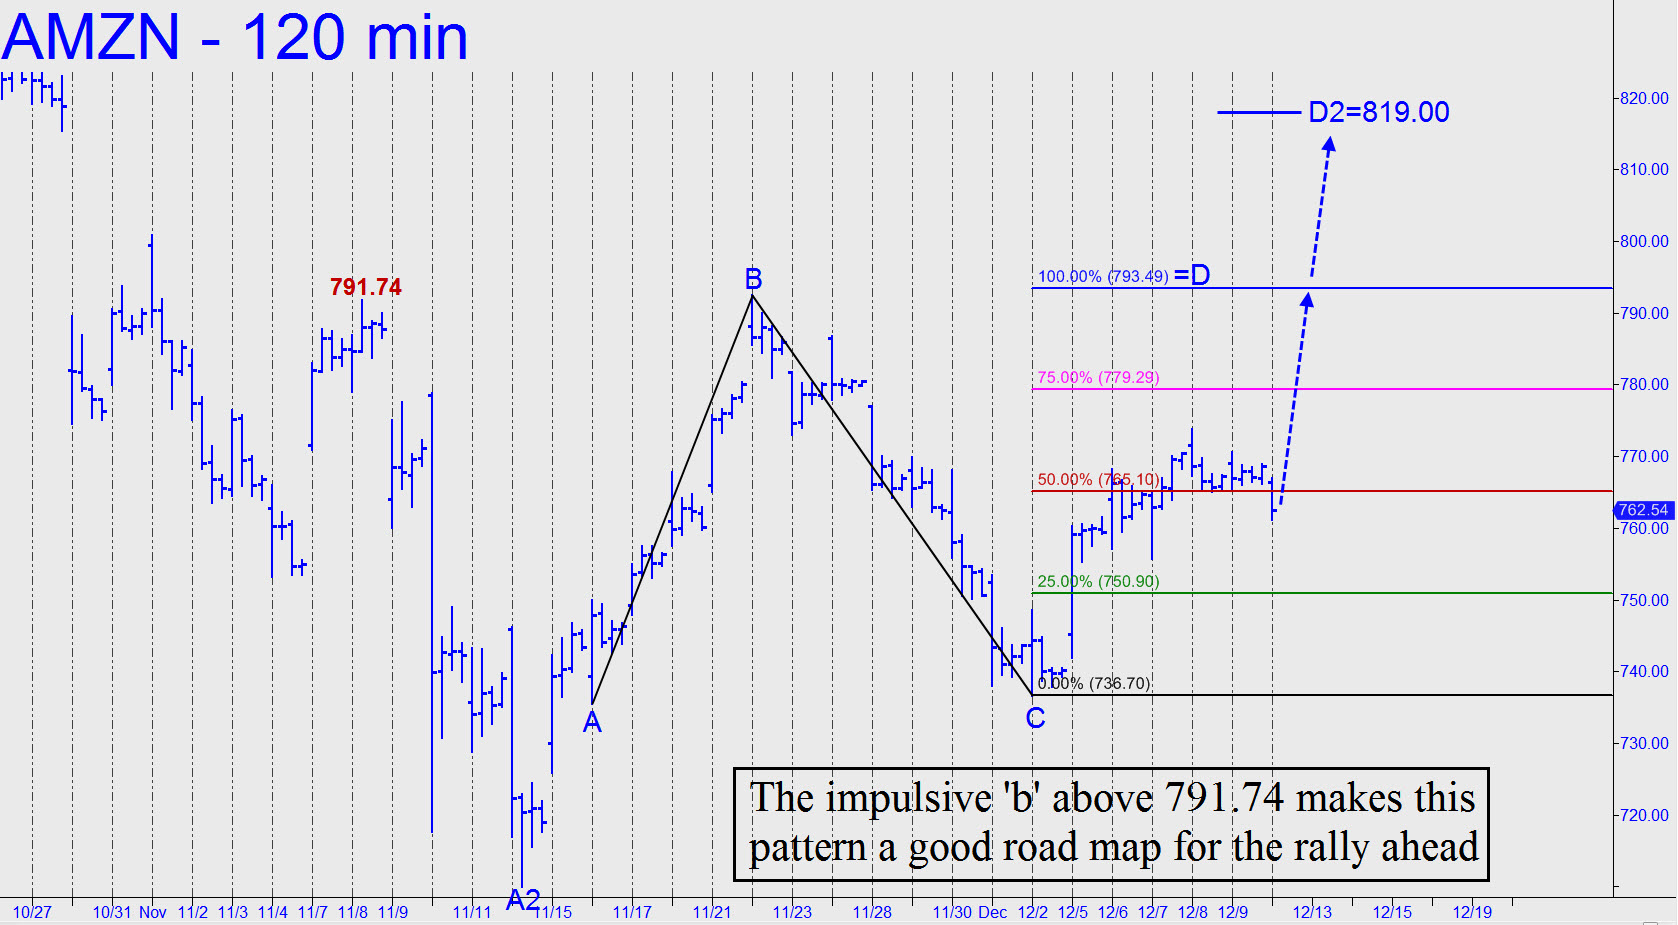
 The corrective pattern shown (see inset) makes the prospect of bottom-fishing at the 725.91 midpoint pivot look very appealing. A similar retracement in AAPL suggests that the two stocks could bottom synchronously, adding further to the enticement. My hunch is that the AMZN pivot will yield a tradable bounce with great precision, implying it will come from within 0.20-0.40 of the 725.91 support. Rather than trying to catch a falling spear, however, I’ll recommend using ‘camouflage’ to set up the trade on the five-minute (or so) chart. If you’re uncertain about what this entails, stay tuned to the chat room if and when AMZN gets within $2 of the target. In the meantime, I’ve set a chart alert to go off if and when the stock falls to $728. _______ UPDATE (Dec 5, 10:55 a.m.): So much for that idea. AMZN is up by nearly $19 at the moment, having gone no lower than 736.70. The good news is that there will always be another opportunity to buy the stock — preferably on weakness. _______ UPDATE (8:11 p.m.): I’ve refreshed the chart to show a minor rally pattern with a 776.80 target and a theoretical buy signal at 760.69 that has already triggered. On the 120-minute, A=735.61 (11/16 at 11:30 a.m.); and B=792.40 (11/22 at 11:30 a.m.) _______ UPDATE (Dec 13, 9:27 p.m.): The pullback to the red line did not quite qualify as a mechanical buy, but the pattern (see inset) is viable, as are its targets. A single round lot can provide quite a boost to a trader’s bottom line — worth nearly $7000 from the green line if the stock eventually achieves D=819.00
