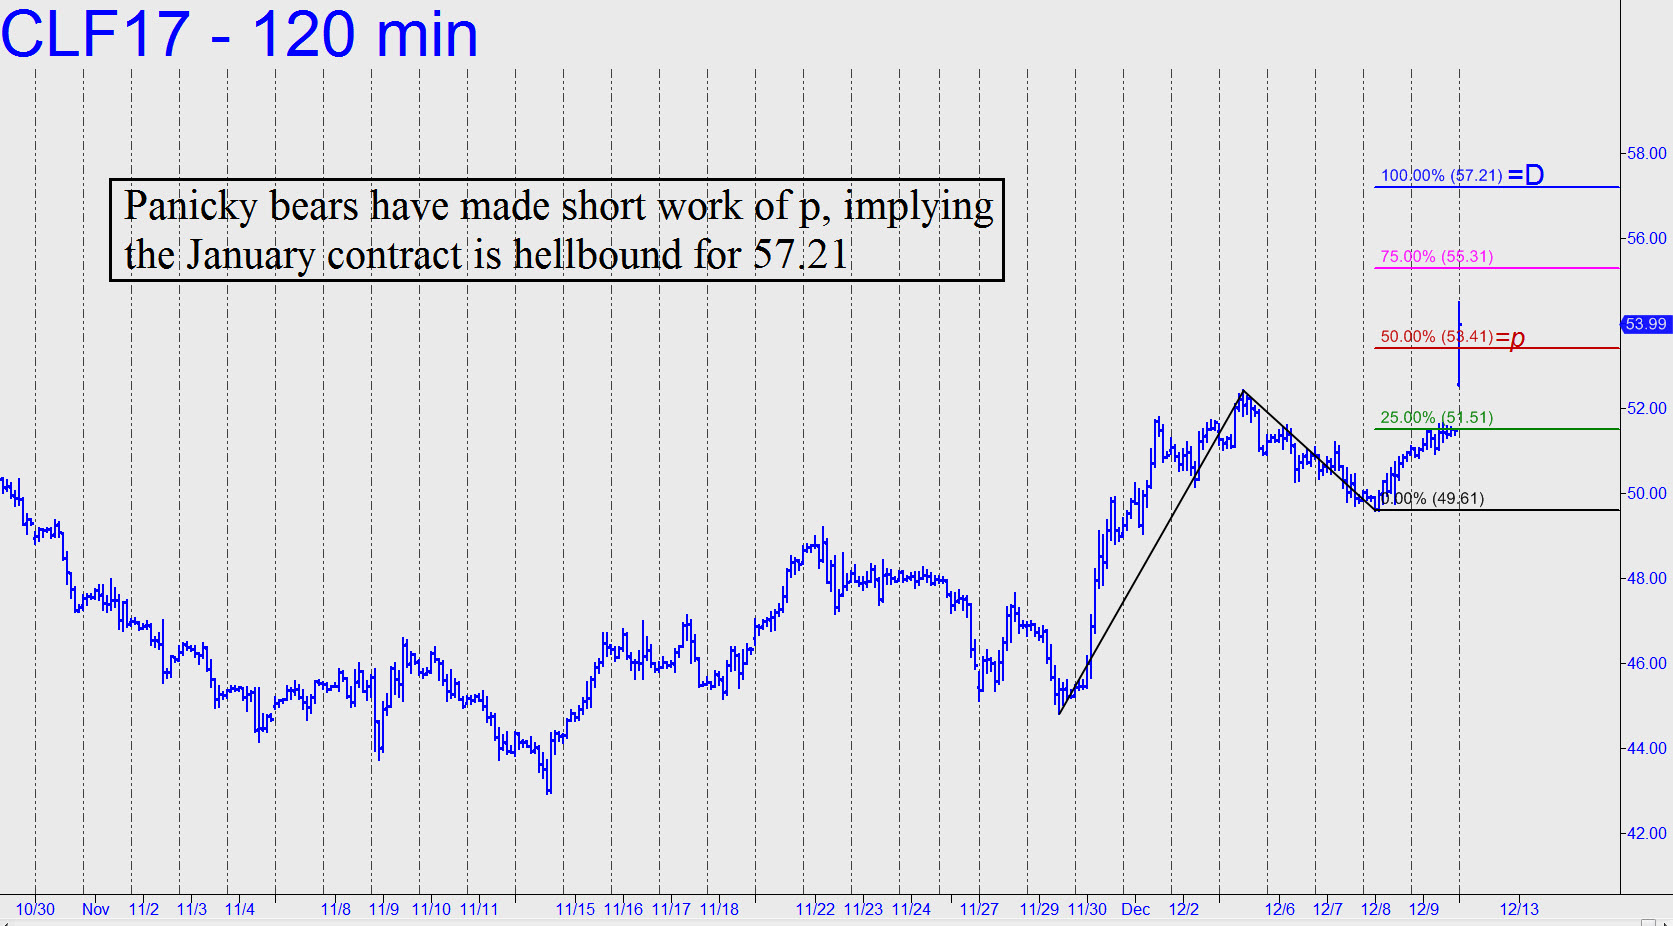
 We have rally targets outstanding that range as high as 55.93. However, because we prefer to take our targets one at a time to avoid focusing on the wild blue yonder, we must reckon with the fact that crude’s impressive-looking surge from around $45 in the last week has fallen somewhat shy of a lesser Hidden Pivot target at 53.35. This suggests the upthrust, although steep, is not as powerful as it might seem. In fact, the move is not even bullishly impulsive on the daily chart, since it failed to exceed the two prior peaks we require to generate a legitimate impulse leg. The rally did exceed one prior peak, but it’s an ‘internal’ one rather than an ‘external’ — another reason why the melt-up is still less than impressive at this point. Buyers need only have pushed the futures a further 27 cents to take out mid-October’s external peak at 52.68; instead, they chickened out just inches from the goal line. While this doesn’t negate the possibility that January Crude is bound for new recovery highs above $54, the subtle weakness should temper our bullish enthusiasm if and when crude reaches those levels. Could the entire move from January’s lows near $34 have been just a dead-cat bounce? Quite possibly, and that’s why we should pay very close attention to price action at key Hidden Pivot resistance points not far above, as well as to abcd retracements of minute degree. For if they begin to exceed their ‘d’ downside targets, that would be evidence that crude’s massive upward correction in 2016 is at an end, and that a resumption of a bear market that will see crude fall into the $20s is at hand. _______ UPDATE (Dec 11, 6:59 p.m. ET): This evening’s rabid short squeeze has hit 54.51 so far, a meaningless number that lies between the two Hidden Pivot targets given above. Judging from the ease with which buyers have blown past the 53.41 midpoint pivot (see inset, a new chart), the rally is a very good bet to hit p2=55.31, and thence D=57.21.
