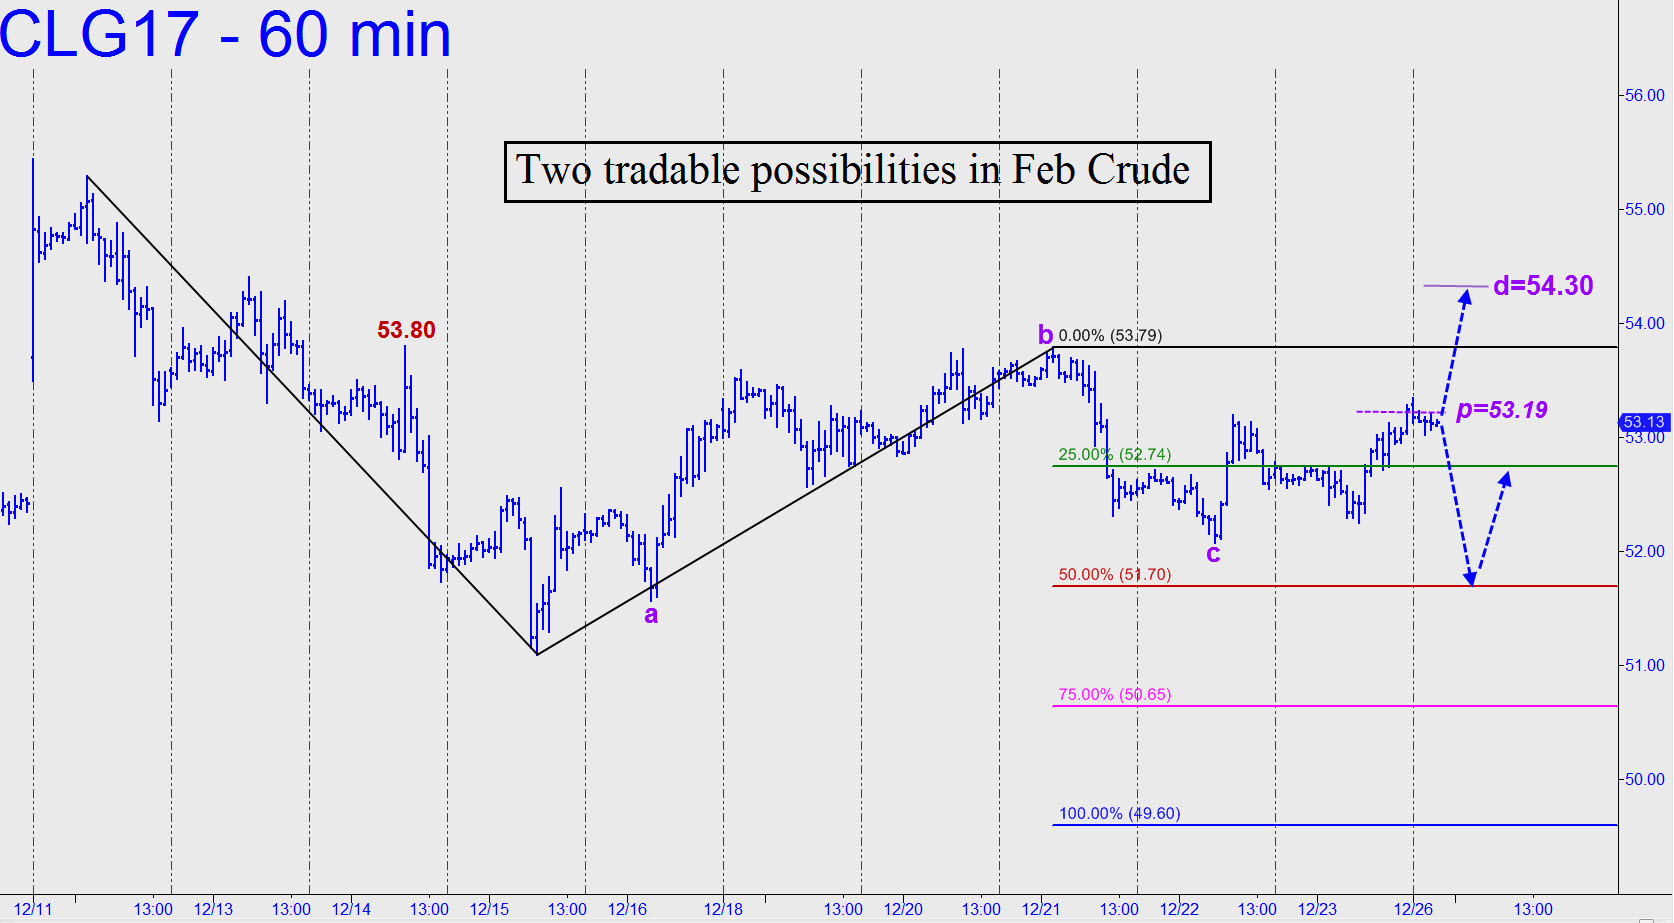
 The rally from the December 15 low at 51.10 is merely corrective due to its failure to take out the ‘external’ peak at 53.80 shown in the chart (see inset). If buyers fail at this for another day or two, we could see the Feb contract relapse to p=51.70. It would be a fetching speculative buy at that price, but we won’t try to jump the gun with a bid at these levels. Alternatively, a pop on Tuesday could be expected to hit 54.30 by Wednesday’s close. Traders could use p=53.19 to establish a ‘mechanical’ bid once the pivot has been exceeded for several bars. This trade should be attempted only if you are comfortable with the simple rules governing this type of trade. For guidance in real time stay close to the chat room, since crude has an avid following there._______ UPDATE (Dec 27, 7:39 p.m. ET): The 54.30 target I provided in the chat room remains valid, based on this 60-minute pattern: A=51.57 (12/16); B= 53.79 (12/21); C=52.08. This evening’s pullback to p2=53.75 can be bought ‘mechanically’, but the required 53.57 stop-loss would not leave much room for error. Two possible alternatives: using camouflage, via the 5-minute chart or less, to generate a ‘buy’ signal; or using a mechanical bid at 53.19, stop 52.82. That last tactic would be the easiest way to go, but there are no guarantees the pullback will come down to the pivot. I am not recommending shorting at 54.30 to anyone who hasn’t caught a profitable piece of the rally. _______ UPDATE (Dec 28, 11:49 p.m.): The tracking trade was closed out a single penny from the recent top for a theoretical gain of $510 per contract. Since no subscribers reported reversing the position and getting short at the peak of the rally, I have not established a tracking position.
